Figures & data
Figure 1 Effects of CNF samples on viability and morphology of DC.
Notes: (A) Viability of DC after the culture with CNF samples relative to control DC (100%). (B) A representative flow cytometry analysis of SSC/FSC, and the summarized data from seven experiments with different donors are shown as fold change of control DC ± SD. (C) MGG-stained DC collected after the cultures with CNF. (D) Epi-fluorescent images of CNF-treated DC after staining with phalloidin rhodamine-actin (red), anti-CD209-IgG Alexa 488 (green), calcofluor white-CNF (dark blue), and DAPI-nuclei (light blue). Scale bars represent 10 μm. (E) Fluorescence intensity (CD209 and actin) in the contact area with nCNF (3) against the cytoplasmic part of the cells (whole cell excluding nucleus [2]) was calculated as MGV relative to control DC, and the data for each cell measured in one experiment are shown with indicated median and range statistics. (F) The surface expression of CD209 on DC, as determined by flow cytometry. The results are shown as mean MFI ± SD of three independent experiments. (C, D) Image scale bars represent 10 μm. (E, F) *P<0.05 compared to control, or as indicated (RM ANOVA with Tukey’s post-test).
Abbreviations: APA, 3-aminopropylphosphoric acid; APAc, APA-functionalized; c, carboxylated; CNF, cellulose nanofibrils; DC, dendritic cells; FSC, forward scatter; MFI, mean fluorescence intensity; MGG, May-Grunwald Giemsa; MGV, mean gray value; n, native; RM, repeated measures; SSC, side scatter.
![Figure 1 Effects of CNF samples on viability and morphology of DC.Notes: (A) Viability of DC after the culture with CNF samples relative to control DC (100%). (B) A representative flow cytometry analysis of SSC/FSC, and the summarized data from seven experiments with different donors are shown as fold change of control DC ± SD. (C) MGG-stained DC collected after the cultures with CNF. (D) Epi-fluorescent images of CNF-treated DC after staining with phalloidin rhodamine-actin (red), anti-CD209-IgG Alexa 488 (green), calcofluor white-CNF (dark blue), and DAPI-nuclei (light blue). Scale bars represent 10 μm. (E) Fluorescence intensity (CD209 and actin) in the contact area with nCNF (3) against the cytoplasmic part of the cells (whole cell excluding nucleus [2]) was calculated as MGV relative to control DC, and the data for each cell measured in one experiment are shown with indicated median and range statistics. (F) The surface expression of CD209 on DC, as determined by flow cytometry. The results are shown as mean MFI ± SD of three independent experiments. (C, D) Image scale bars represent 10 μm. (E, F) *P<0.05 compared to control, or as indicated (RM ANOVA with Tukey’s post-test).Abbreviations: APA, 3-aminopropylphosphoric acid; APAc, APA-functionalized; c, carboxylated; CNF, cellulose nanofibrils; DC, dendritic cells; FSC, forward scatter; MFI, mean fluorescence intensity; MGG, May-Grunwald Giemsa; MGV, mean gray value; n, native; RM, repeated measures; SSC, side scatter.](/cms/asset/8fb38e68-38bb-476e-9495-6bae04ded6e0/dijn_a_12194315_f0001_c.jpg)
Figure 2 Effects of CNF samples on DC differentiation, maturation, and cytokines production.
Notes: (A) A representative analysis of CD1a/CD14 expression on DC after the culture with CNF samples, and (B) the summarized results on % of CD14+ and CD1a+ DC. (C, D) The phenotypic analysis of DC 16 hours after LPS/IFN-γ stimulation or without stimulation (medium) for the indicated surface markers (C) or intracellular cytokines (D) is shown. (E) The levels of cytokines in DC culture supernatants as determined by ELISA. The data from seven (B–D) or five (E) independent experiments with different DC donors are presented as mean ± SD. *P<0.05 as indicated (RM ANOVA Tukey’s post-test).
Abbreviations: APA, 3-aminopropylphosphoric acid; APAc, APA-functionalized; c, carboxylated; CNF, cellulose nanofibrils; DC, dendritic cells; FSC, forward scatter; HLA, human leukocyte antigen; IFN, interferon; LPS, lipopolysaccharide; MFI, mean fluorescence intensity; n, native; RM, repeated measures; SSC, side scatter; TGF, transforming growth factor.
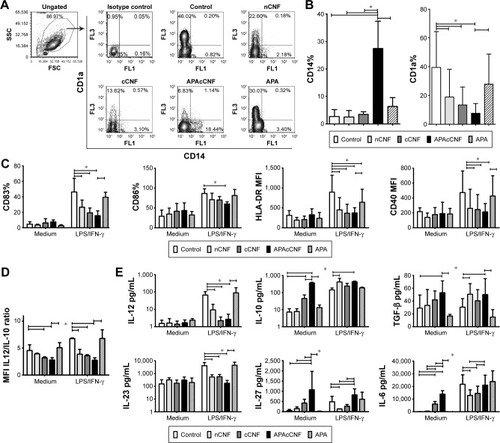
Figure 3 Effects of CNF samples on Th-polarization capacity of DC.
Notes: (A) A representative analysis of CFSE-labeled CD3+ T-cell proliferation in coculture with LPS/IFN-γ stimulated DC at 1:20 (DC:T cell) ratio (the number indicate proliferation index). (B) The summarized results on proliferation from four independent experiments are shown as mean proliferation index ± SD. (C) The levels of cytokines in DC/CD3+ T-cell cocultures measured by specific ELISA are shown as mean pg/mL ± SD from four independent experiments. (D) A representative analysis of intracellular cytokines’ expression in CD3+ T cells from DC/T cocultures. The data from three experiments with T cells which showed a marked expression of cytokines are shown. This was done since highly variable production of these cytokines by different T-cell donors was shown previously.Citation45 (E) The summarized data from five independent experiments carried out with LPS/IFN-γ-stimulated DC are shown as mean % of positive cells within CD4+ or CD4− (CD8+) T cells ± SD. *P<0.05 as indicated (RM ANOVA).
Abbreviations: APA, 3-aminopropylphosphoric acid; APAc, APA-functionalized; c, carboxylated; CFSE, carboxyfluorescein succinimidyl ester; CNF, cellulose nanofibrils; DC, dendritic cells; IFN, interferon; LPS, lipopolysaccharide; n, native; RM, repeated measures; Th, T helper cell.
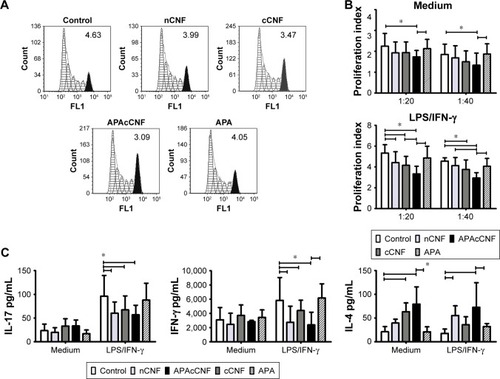
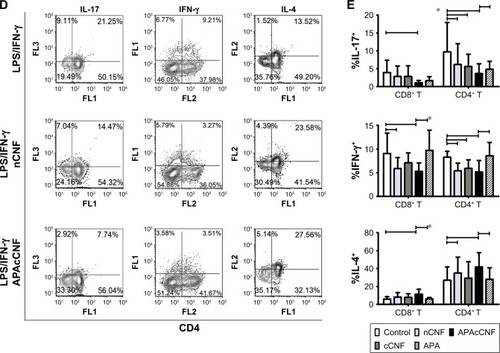
Figure 4 IDO-1-dependent mechanisms in tolerogenic effects of CNF-treated DC.
Notes: (A) A representative analysis of IDO-1 expression in DC gated cells is shown and, (B) the summarized data from three independent experiments are shown as mean ± SD. (C) A representative analysis of CD4+CD25hiFoxP3hi T cells after the cultures with DC is shown and, (D) the summarized data from four independent experiments are shown as mean % ± SD. Representative data for cCNF- DC, omitted in A and C, were similar to those obtained with APAcCNF-treated DC. (E) The levels of cytokines in supernatants of DC/T cell cocultures are shown as mean pg/mL of three independent experiments. (F) The proliferation of allogeneic responder CFSE-labeled CD3+ T cells in the presence of T cells primed with DC from three independent experiments is shown as mean proliferation index ± SD. *P<0.05 compared to corresponding control, or as indicated (RM ANOVA).
Abbreviations: 1-MT, one methyl tryptophan; APA, 3-aminopropylphosphoric acid; APAc, APA-functionalized; c, carboxylated; CNF, cellulose nanofibrils; DC, dendritic cells; FoxP, forkhead box protein; IDO, indolamine dioxygenase; IFN, interferon; LPS, lipopolysaccharide; n, native; RM, repeated measures; TGF, transforming growth factor.
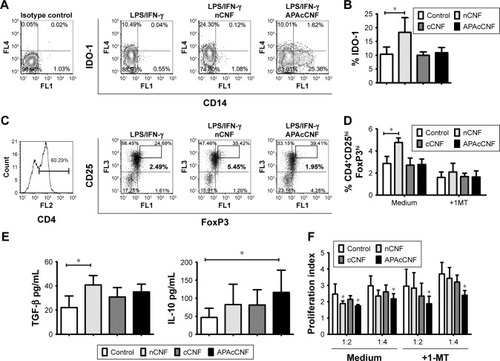
Figure 5 ILT3-dependent mechanisms of APAcCNF-DC.
Notes: (A) A representative analysis of ILT3 and ILT4 in CNF-treated DC and, (B) the summarized data from four independent experiments are shown as mean ± SD. (C) The analysis of IL-10 and IFN-γ expression in T cells primed with DC from one experiment is shown (gating markers from CD8+ and CD8− [CD4+] T cell populations are indicated by arrows), and (D) the summarized data on % of total IL-10+ cells within CD8+ and CD4+ T cells is presented as mean ± SD of four independent experiments. *P<0.05 as indicated (RM ANOVA).
Abbreviations: APA, 3-aminopropylphosphoric acid; APAc, APA-functionalized; CNF, cellulose nanofibrils; DC, dendritic cells; IFN, interferon; ILT, immunoglobulin-like transcript; LPS, lipopolysaccharide; RM, repeated measures.
![Figure 5 ILT3-dependent mechanisms of APAcCNF-DC.Notes: (A) A representative analysis of ILT3 and ILT4 in CNF-treated DC and, (B) the summarized data from four independent experiments are shown as mean ± SD. (C) The analysis of IL-10 and IFN-γ expression in T cells primed with DC from one experiment is shown (gating markers from CD8+ and CD8− [CD4+] T cell populations are indicated by arrows), and (D) the summarized data on % of total IL-10+ cells within CD8+ and CD4+ T cells is presented as mean ± SD of four independent experiments. *P<0.05 as indicated (RM ANOVA).Abbreviations: APA, 3-aminopropylphosphoric acid; APAc, APA-functionalized; CNF, cellulose nanofibrils; DC, dendritic cells; IFN, interferon; ILT, immunoglobulin-like transcript; LPS, lipopolysaccharide; RM, repeated measures.](/cms/asset/35b54cc0-afd2-417d-8ebe-7a8098fd42a4/dijn_a_12194315_f0005_b.jpg)
Figure 6 Phenotype of regulatory CD8+CD25+ T cells induced by DC.
Notes: (A) MACS purification and gating strategy of CD8+ T cells cocultivated with DC in the presence or absence of blocking anti-ILT-3 Ab (see also Figure S3 for the experiments with the blocking anti-ILT-4 Ab), for the analysis of IFN-γ, IL-10, CTLA-4, and TGF-β expression within CD25+CD8+ population. (B) The summarized data from four different experiments are shown as mean ± SD. *P<0.05 as indicated (RM ANOVA). (C) The proliferation (CFSE) and cell-death (PI) analysis of the allogeneic CFSE-labeled CD3+ T cells cocultivated with DC-primed CD8+T cells. A representative analysis and the summarized data from four independent experiments are shown as mean % of proliferated responders ± SD. (D) Cytotoxic activity of DC-primed CD8+ T cells toward CFSE-labeled tumor HEp-2 cells. Representative data on gated CFSE + HEp-2 cells are shown, and the summarized data from three different experiments are shown as mean ± SD. *P<0.05 compared to control (paired t-test).
Abbreviations: Ab, antibody; aILT-3, blocking anti-ILT-3 antibody; APA, 3-aminopropylphosphoric acid; APAc, APA-functionalized; CFSE, carboxyfluorescein succinimidyl ester; CNF, cellulose nanofibrils; CTLA, cytotoxic T-lymphocyte-associated protein; DC, dendritic cells; IFN, interferon; +IrAb, irrelevant antibody; ILT, immunoglobulin-like transcript; LPS, lipopolysaccharide; MACS, magnetic-activated cell sorting; PBMC, peripheral blood mononuclear cells; PI, propidium iodide; RM, repeated measures; TGF, transforming growth factor.
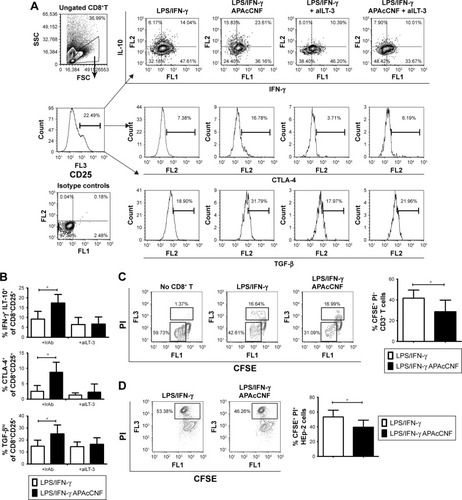
Figure S1 TEM analysis of CNF samples.
Abbreviations: APA, 3-aminopropylphosphoric acid; APAc, APA-functionalized; c, carboxylated; CNF, cellulose nanofibrils; n, native; TEM, transmission electron microscopy.
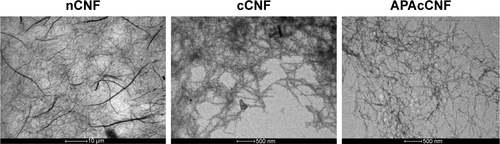
Figure S2 Role of IL-6 in differentiation and maturation of DC treated with APAcCNF.
Notes: (A) A representative analysis of CD1a/CD14 expression on DC cultivated with APAcCNF in the presence of aIL-6R or isotype control Abs is shown and, (B) the summarized results are presented as mean ± SD of three independent experiments. (C) A representative analysis of DC phenotype after 16 hours of stimulation with LPS/IFN-γ is shown, out of three experiments with similar results. *P<0.05 as indicated (RM ANOVA).
Abbreviations: aIL-6RAb, anti-IL-6 receptor antibody (tocilizumab); APA, 3-aminopropylphosphoric acid; APAc, APA-functionalized; c, carboxylated; CNF, cellulose nanofibrils; DC, dendritic cells; HLA, human leukocyte antigen; IFN, interferon; IrAb, isotype control antibody; LPS, lipopolysaccharide; n, native; RM, repeated measures.
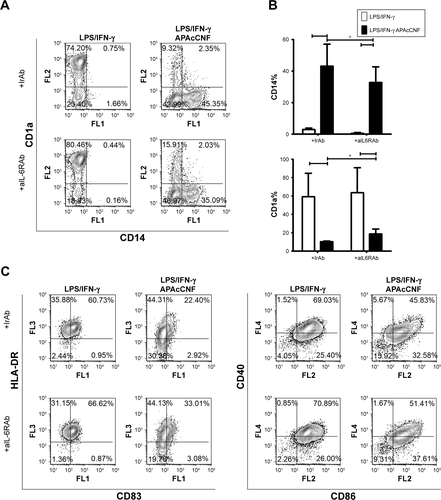
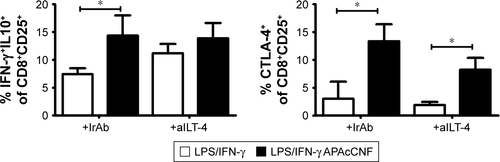
Figure S3 ILT4-dependent mechanisms of APAcCNF-DC.
Notes: The summarized data on phenotype of MACS-sorted CD8+CD25+ T cells co-cultivated with DC in the presence or absence of blocking anti-ILT4 Ab data from four different experiments is shown as mean ± SD. *P<0.05 as indicated (RM ANOVA).
Abbreviations: Ab, antibody; aILT-4, blocking anti-ILT-4 antibody; APA, 3-aminopropylphosphoric acid; APAc, APA-functionalized; CNF, cellulose nanofibrils; CTLA, cytotoxic T-lymphocyte-associated protein; DC, dendritic cells; IFN, interferon; ILT, immunoglobulin-like transcript; +IrAb, irrelevant antibody; LPS, lipopolysaccharide; MACS, magnetic-activated cell sorting; RM, repeated measures.