Figures & data
Figure 1 Diagram of transosseous supraspinatus tendon repair with GO-PLGA fibrous membranes.
Abbreviations: GO, graphene oxide; PLGA, poly(lactic-co-glycolic acid).
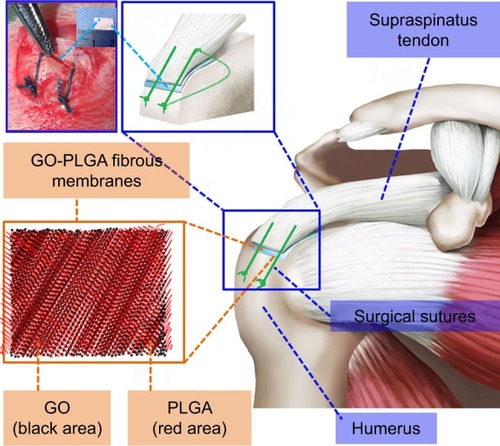
Figure 2 (A) Scanning electron microscopy images and (B) representative stress–strain curves of electrospun PLGA and GO-PLGA nanofibrous membranes.
Abbreviations: GO, graphene oxide; PLGA, poly(lactic-co-glycolic acid).
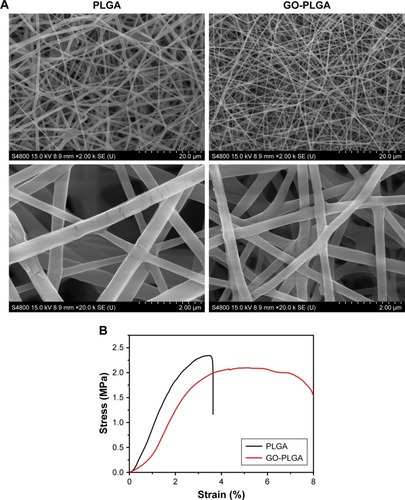
Figure 3 (A) CCK-8 assay, (B) ALP activity, and (C) Alizarin Red staining of the BC, PLGA, and GO-PLGA groups after rabbit BMSCs were seeded onto electrospun nanofibrous membranes.
Notes: Results are presented as the mean±SD (n=3 for each group). *P<0.05 vs control; **P<0.01 vs control; ***P<0.001 vs control; ΔP<0.05 vs PLGA; ΔΔP<0.01 vs PLGA.
Abbreviations: BC, blank control; BMSC, bone marrow mesenchymal stem cell; CCK-8, Cell Counting Kit-8; GO, graphene oxide; PLGA, poly(lactic-co-glycolic acid); D, days.
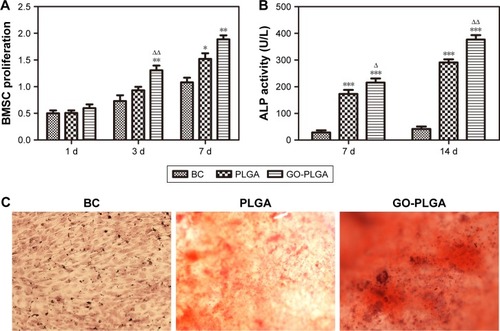
Figure 4 (A) Representative microcomputed tomography images of the proximal humerus and (B) analysis of BMD and BV/TV.
Notes: Black arrows and red rectangles indicate newly formed bone between supraspinatus tendon and bone. Results are presented as the mean±SD (n=6 for each group). *P<0.05 vs control; **P<0.01 vs control; ***P<0.001 vs control; ΔΔP<0.01 vs PLGA; ΔΔΔP<0.001 vs PLGA.
Abbreviations: BV/TV, bone volume/total volume; BMD, bone mineral density; GO, graphene oxide; PLGA, poly(lactic-co-glycolic acid); W, weeks.
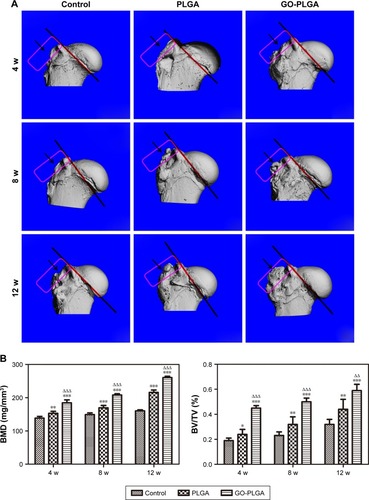
Figure 5 Representative H&E-stained tissue sections (40×) of the supraspinatus tendon insertion site at 4, 8, and 12 weeks postoperatively.
Note: Scale bars for H&E-stained images=200 µm.
Abbreviations: GO, graphene oxide; PLGA, poly(lactic-co-glycolic acid); B, bone; I, interface; T, tendon; W, weeks.
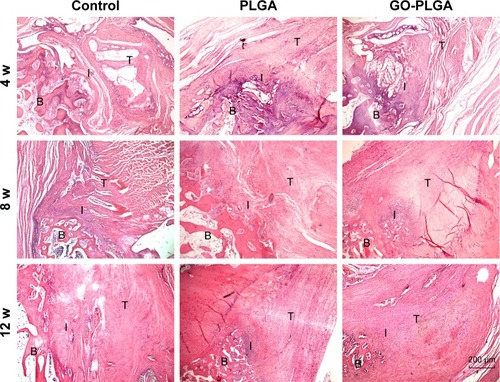
Figure 6 Representative histology images of the cartilage tissue at the insertion site (40× magnification).
Notes: Yellow region indicates newly formed cartilage between supraspinatus tendon and bone. Scale bars for H&E-stained images=200 µm.
Abbreviations: GO, graphene oxide; PLGA, poly(lactic-co-glycolic acid); B, bone; I, interface; T, tendon; W, weeks.
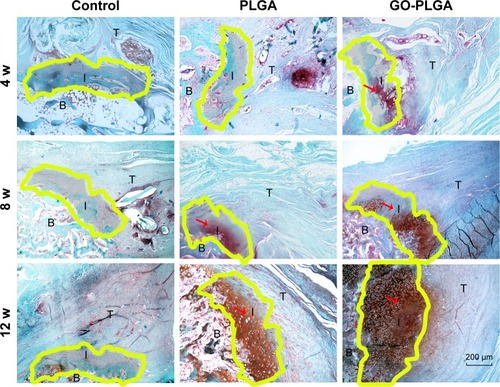
Figure 7 (A) Representative picrosirius red-stained tissue sections of the healing enthesis (100×) and (B) analysis of the collagen birefringence.
Notes: Rectangle indicates the area of interest for collagen organization. Results are presented as the mean±SD (n=6 for each group). **P<0.01 vs control; ***P<0.001 vs control; ΔΔΔP<0.001 vs PLGA.
Abbreviations: GO, graphene oxide; PLGA, poly(lactic-co-glycolic acid); B, bone; I, interface; T, tendon; W, weeks.
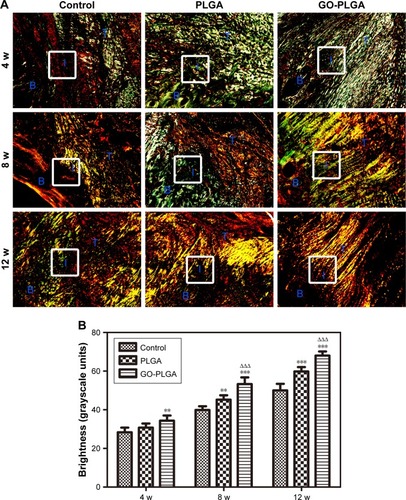
Figure 8 Biomechanical testing of the tendon at the insertion site: (A) cross-sectional areas, (B) ultimate load to failure, (C) stress to failure values, and (D) stiffness.
Notes: Results are presented as the mean±SD (n=6 for each group). *P<0.05 vs control; **P<0.01 vs control; ***P<0.001 vs control; ΔP<0.05 vs PLGA; ΔΔP<0.01 vs PLGA.
Abbreviations: GO, graphene oxide; PLGA, poly(lactic-co-glycolic acid); W, weeks.
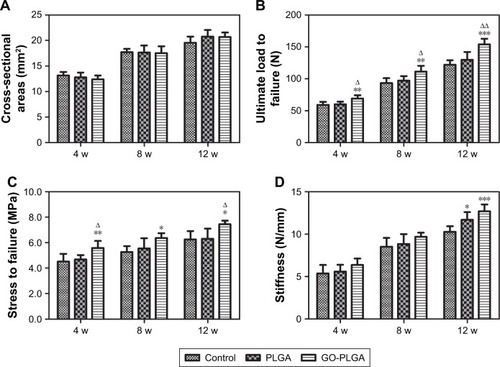
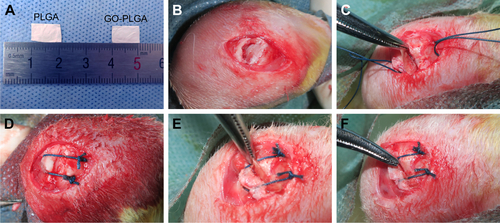
Figure S1 (A) General view of PLGA and PLGA-GO membranes and (B–F) surgical procedure of interposition of PLGA and PLGA-GO membranes in the rabbit supraspinatus tendon repair model.
Abbreviations: GO, graphene oxide; PLGA, poly(lactic-co-glycolic acid).