
Figures & data
Figure 1 Characterization of rGO-PAMAM-Fc nanomaterials.
Notes: (A) 1H NMR spectrum of PAMAM. (B) FT-IR spectra of (a) rGO, (b) Fc, (c) PAMAM, (d) rGO-PAMAM-Fc nanomaterials. (C) UV–vis spectra of (a) rGO, (b) Fc, (c) PAMAM, (d) rGO-PAMAM-Fc nanomaterials. (D) Raman spectrum of (a) rGO, (b) rGO-PAMAM-Fc nanomaterials. (E) AFM of rGO-PAMAM-Fc nanomaterials. (F) Cyclic voltammogram response of various electrodes: (a) bare GE, (b) MEA/GE, (c) rGO-PAMAM-Fc/MEA/GE from −0.2 to 0.6 V with a scan rate of 100 mV/s in PBS containing 5 mM [Fe(CN)6]3−/4−.
Abbreviations: AFM, atomic force microscope; Fc, ferrocene; GE, gold electrode; NMR, nuclear magnetic resonance; NPs, nanoparticles; PAMAM, polyamidoamine; rGO, reduced graphene oxide; UV, ultraviolet.
![Figure 1 Characterization of rGO-PAMAM-Fc nanomaterials.Notes: (A) 1H NMR spectrum of PAMAM. (B) FT-IR spectra of (a) rGO, (b) Fc, (c) PAMAM, (d) rGO-PAMAM-Fc nanomaterials. (C) UV–vis spectra of (a) rGO, (b) Fc, (c) PAMAM, (d) rGO-PAMAM-Fc nanomaterials. (D) Raman spectrum of (a) rGO, (b) rGO-PAMAM-Fc nanomaterials. (E) AFM of rGO-PAMAM-Fc nanomaterials. (F) Cyclic voltammogram response of various electrodes: (a) bare GE, (b) MEA/GE, (c) rGO-PAMAM-Fc/MEA/GE from −0.2 to 0.6 V with a scan rate of 100 mV/s in PBS containing 5 mM [Fe(CN)6]3−/4−.Abbreviations: AFM, atomic force microscope; Fc, ferrocene; GE, gold electrode; NMR, nuclear magnetic resonance; NPs, nanoparticles; PAMAM, polyamidoamine; rGO, reduced graphene oxide; UV, ultraviolet.](/cms/asset/33a69b7a-31e2-441d-98fe-43b4f29c6450/dijn_a_12190643_f0001_c.jpg)
Figure 2 Electrochemical behaviors of the biosensor.
Notes: (A) CV response of (a) bare GE, (b) MEA/GE, (c) rGO-PAMAM-Fc/MEA/GE, (d) (rGO-PAMAM-Fc)2/MEA/GE, (e) (rGO-PAMAM-Fc)3/MEA/GE, (f) (rGO-PAMAM-Fc)4/MEA/GE, (g) (rGO-PAMAM-Fc)5/MEA/GE, (h) Au NPs/(rGO-PAMAM-Fc)5/MEA/GE, (i) ChOx&ChEt/Au NPs/(rGO-PAMAM-Fc)5/MEA/GE in [Fe(CN)6]3−/4− solution from −0.4 to 0.8 V with a scanning rate of 100 mV/s. (B) EIS of (a) bare GE, (b) MEA/GE, (c) rGO-PAMAM-Fc/MEA/GE, (d) (rGO-PAMAM-Fc)2/MEA/GE, (e) (rGO-PAMAM-Fc)3/MEA/GE, (f) (rGO-PAMAM-Fc)4/MEA/GE, (g) (rGO-PAMAM-Fc)5/MEA/GE, (h) Au NPs/(rGO-PAMAM-Fc)5/MEA/GE, (i) ChOx&ChEt/Au NPs/(rGO-PAMAM-Fc)5/MEA/GE in PBS containing 5 mM Fe(CN)63−/4− at 0.24 V (vs SCE) with a frequency range of 0.1–100 kHz. (C) Current response toward 5 µM cholesterol by LSV with the different modifications, including bare GE, ChOx&ChEt/rGO-PAMAM-Fc/GE, ChOx&ChEt/Au NPs/rGO-PAMAM/GE, ChOx&ChEt/Au NPs/PAMAM-Fc/GE, ChOx&ChEt/Au NPs/PAMAM/GE and ChOx&ChEt/Au NPs/(rGO-PAMAM-Fc)/GE. Error bars represent the standard error of the mean (n=3 electrodes).
Abbreviations: CV, cyclic voltammetry; EIS, electrochemical impedance spectroscopy; Fc, ferrocene; GE, gold electrode; LSV, linear sweep voltammetry; NPs, nanoparticles; PAMAM, polyamidoamine; rGO, reduced graphene oxide; SCE, saturated calomel electrode.
![Figure 2 Electrochemical behaviors of the biosensor.Notes: (A) CV response of (a) bare GE, (b) MEA/GE, (c) rGO-PAMAM-Fc/MEA/GE, (d) (rGO-PAMAM-Fc)2/MEA/GE, (e) (rGO-PAMAM-Fc)3/MEA/GE, (f) (rGO-PAMAM-Fc)4/MEA/GE, (g) (rGO-PAMAM-Fc)5/MEA/GE, (h) Au NPs/(rGO-PAMAM-Fc)5/MEA/GE, (i) ChOx&ChEt/Au NPs/(rGO-PAMAM-Fc)5/MEA/GE in [Fe(CN)6]3−/4− solution from −0.4 to 0.8 V with a scanning rate of 100 mV/s. (B) EIS of (a) bare GE, (b) MEA/GE, (c) rGO-PAMAM-Fc/MEA/GE, (d) (rGO-PAMAM-Fc)2/MEA/GE, (e) (rGO-PAMAM-Fc)3/MEA/GE, (f) (rGO-PAMAM-Fc)4/MEA/GE, (g) (rGO-PAMAM-Fc)5/MEA/GE, (h) Au NPs/(rGO-PAMAM-Fc)5/MEA/GE, (i) ChOx&ChEt/Au NPs/(rGO-PAMAM-Fc)5/MEA/GE in PBS containing 5 mM Fe(CN)63−/4− at 0.24 V (vs SCE) with a frequency range of 0.1–100 kHz. (C) Current response toward 5 µM cholesterol by LSV with the different modifications, including bare GE, ChOx&ChEt/rGO-PAMAM-Fc/GE, ChOx&ChEt/Au NPs/rGO-PAMAM/GE, ChOx&ChEt/Au NPs/PAMAM-Fc/GE, ChOx&ChEt/Au NPs/PAMAM/GE and ChOx&ChEt/Au NPs/(rGO-PAMAM-Fc)/GE. Error bars represent the standard error of the mean (n=3 electrodes).Abbreviations: CV, cyclic voltammetry; EIS, electrochemical impedance spectroscopy; Fc, ferrocene; GE, gold electrode; LSV, linear sweep voltammetry; NPs, nanoparticles; PAMAM, polyamidoamine; rGO, reduced graphene oxide; SCE, saturated calomel electrode.](/cms/asset/41c05c81-da1e-41ad-9d2e-05203272047e/dijn_a_12190643_f0002_c.jpg)
Figure 3 Characterization of the ChOx&ChEt/Au NPs/rGO-PAMAM-Fc biosensor.
Notes: SEM images of (A) bare electrode, (B) rGO-PAMAM-Fc/GE, (C) Au NPs/rGO-PAMAM-Fc/GE, (D) ChOx&ChEt/Au NPs/rGO-PAMAM-Fc/GE, and (E) Ag/ChOx&ChEt/ Au NPs/rGO-PAMAM-Fc/GE. (F) EDS image of Ag/ChOx&ChEt/Au NPs/rGO-PAMAM-Fc/GE.
Abbreviations: EDS, energy dispersive spectrometer; Fc, ferrocene; GE, gold electrode; NPs, nanoparticles; PAMAM, polyamidoamine; rGO, reduced graphene oxide; SEM, scanning electron microscope.
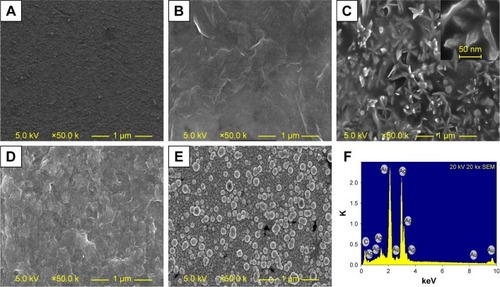
Figure 4 Characterization of the modified electrodes.
Notes: (A) Chronocoulometric curves of (a) GE, (b) rGO-PAMAM-Fc/GE and (c) Au NPs/rGO-PAMAM-Fc/GE for the reduction of 5 mM K3[Fe(CN)6] in 0.1 mol/LPBS. (B) Raman spectrum of (a) rGO/GE, (b) ChOx&ChEt/Au NPs/rGO-PAMAM-Fc/GE. (C) CV for ChOx&ChEt/Au NPs/rGO-PAMAM-Fc/GE in PBS containing 5 mM Fe(CN)63−/4− (scan rate: 10–500 mV/s, scan range: −0.2–0.6 V). (D) The relationship between the square root of the scan rate and the peak current curves, Ipa and Ipc.
Abbreviations: CV, cyclic voltammetry; Fc, ferrocene; GE, gold electrode; NPs, nanoparticles; PAMAM, polyamidoamine; rGO, reduced graphene oxide.
![Figure 4 Characterization of the modified electrodes.Notes: (A) Chronocoulometric curves of (a) GE, (b) rGO-PAMAM-Fc/GE and (c) Au NPs/rGO-PAMAM-Fc/GE for the reduction of 5 mM K3[Fe(CN)6] in 0.1 mol/LPBS. (B) Raman spectrum of (a) rGO/GE, (b) ChOx&ChEt/Au NPs/rGO-PAMAM-Fc/GE. (C) CV for ChOx&ChEt/Au NPs/rGO-PAMAM-Fc/GE in PBS containing 5 mM Fe(CN)63−/4− (scan rate: 10–500 mV/s, scan range: −0.2–0.6 V). (D) The relationship between the square root of the scan rate and the peak current curves, Ipa and Ipc.Abbreviations: CV, cyclic voltammetry; Fc, ferrocene; GE, gold electrode; NPs, nanoparticles; PAMAM, polyamidoamine; rGO, reduced graphene oxide.](/cms/asset/712f6a20-1193-408a-8ce8-fee4dfdad3fa/dijn_a_12190643_f0004_c.jpg)
Figure 5 Optimization of the determining conditions.
Notes: (A) Optimization of the number of layers of rGO-PAMAM-Fc nanomaterial film on GE. (B) Effect of different molecular generations of PAMAM in rGO-PAMAM-Fc nanoparticles toward cholesterol. (C) Effect of temperature of deposition reaction on the current response to cholesterol. (D) Effect of electrodeposition time of Au NPs on the modified electrode. (E) Effect of glycine buffer pH on the current response to cholesterol. (F) Effect of concentration of Ag+ in the glycine buffer. (G) Effect of time of deposition reaction on the current response to cholesterol. The current response was recorded using LSV measurements in 0.1 mol/L HNO3 solution containing 0.6 mol/L KNO3 from −0.2 to 0.6 V at 0.1 V/s scanning rate. Error bars are the standard error of the mean (n=3 electrodes).
Abbreviations: Fc, ferrocene; GE, gold electrode; LSV, linear sweep voltammetry; NPs, nanoparticles; PAMAM, polyamidoamine; rGO, reduced graphene oxide.
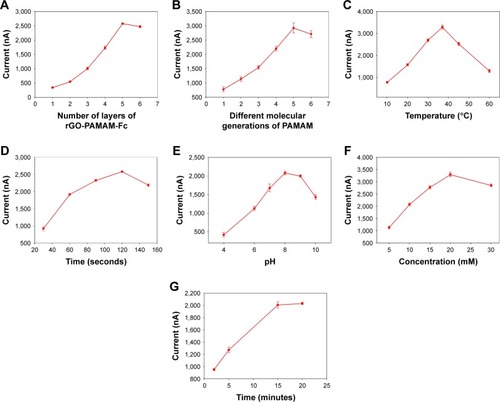
Table 1 Comparison of some characteristics of different electrodes for the determination of cholesterol
Figure 6 Performance of the biosensor toward cholesterol.
Notes: (A) Current response of the ChOx&ChEt/Au NPs/rGO-PAMAM-Fc biosensor toward cholesterol concentration ranging from 1.0×10⁻⁷ to 15.36 mM. (B) Linear relation between current response and logarithm of cholesterol concentration. The current response was recorded using LSV measurements in 0.1 mol/L HNO3 solution containing 0.6 mol/L KNO3 from −0.2 to 0.6 V at a scanning rate of 0.1 V/s. Error bars are the standard error of the mean (n=3 electrodes). (C) The LSV measurement curve toward different concentration of cholesterol.
Abbreviations: Fc, ferrocene; GE, gold electrode; LSV, linear sweep voltammetry; NPs, nanoparticles; PAMAM, polyamidoamine; rGO, reduced graphene oxide.
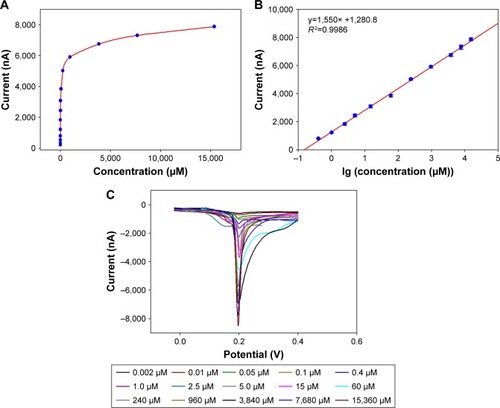
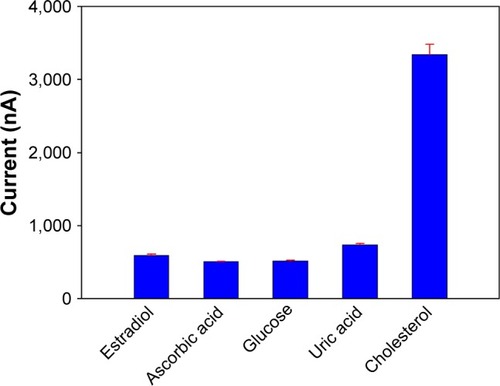
Figure 7 Current of the biosensor in the presence of cholesterol and some interfering substances. Error bars are the standard error of the mean (n=3 electrodes). P>0.05.
Scheme 1 Principle of ChOx&ChEt/Au NPs/rGO-PAMAM-Fc biosensor detecting cholesterol.
Abbreviations: Fc, ferrocene; LSV, linear sweep voltammetry; NPs, nanoparticles; PAMAM, polyamidoamine; rGO, reduced graphene oxide.
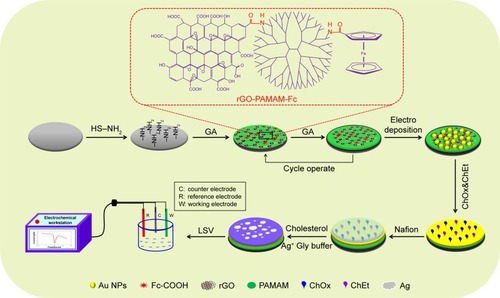
Table 2 Determination and recovery of cholesterol in human serum samples