Figures & data
Table 1 Liposome characteristics describing the fluorescent label and mean/mode diameter (nm) of each prepared liposome batch, and if applicable, the VLA-4 coupling efficiency and loaded drug concentration
Figure 1 Myeloma cell survival when treated with different concentrations of bortezomib or doxorubicin in 2D vs 3D (n=2).
Notes: (A) L363 and MM1S cells were cultured in 2D, or cocultured in 3D with MSCs and EPCs. One day after preparing the cultures, both bortezomib and doxorubicin were added for 48 hours. (B) L363 and MM1S cells were cultured in 2D, or cocultured in 3D with MSCs and EPCs. Seven days after preparing the cultures, both bortezomib and doxorubicin were added for 48 hours. Data are presented as mean ± SD. *P<0.05, **P<0.01. (C) Confocal images of a 3D coculture (7 days precultured) containing L363-GFP (green) and both MSCs and EPCs (DiD, cyan) 48 hours after treatment addition (top: untreated control, bottom: 7.5 nM bortezomib). After 48 hours, ethidium homodimer-1 (red) was added to identify dead cells. Colocalization of the GFP signal and ethidium homodimer-1 identifies dead myeloma cells. Colocalization of DiD and ethidium homodimer-1 identifies dead supporting cells (white arrows). The scale bars represent 150 µm.
Abbreviations: EPCs, endothelial progenitor cells; MSCs, mesenchymal stromal cells.
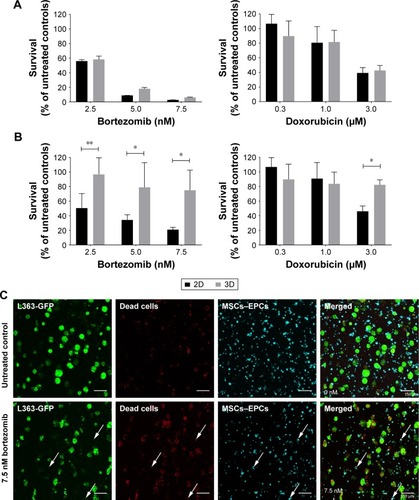
Figure 2 Scanning electron microscopy images of 5 µm cross-sections of 50% Matrigel containing myeloma cells, EPCs and MSCs cultured for 14 days.
Notes: (A) Gel meshwork with various pore sizes with the majority <200 nm. The scale bar represents 5 µm. (B) Cross-section of a cell incorporated into the gel. The scale bar represents 5 µm. (C) Zoom of (B), showing more details of the cell and meshwork of the surrounding gel. The scale bar represents 3 µm. Abbreviations: EPCs, endothelial progenitor cells; MSCs, mesenchymal stromal cells; N, nucleus; NC, nucleolus; PM, plasma membrane.
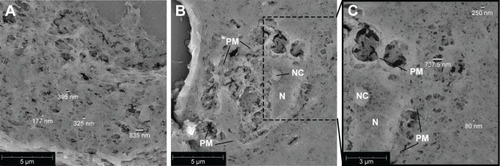
Figure 3 Diffusion of different sized liposomes in the 3D model: small (~75 nm), intermediate (~100 nm), and large (~180 nm).
Notes: (A) 3D confocal images showing 3D cocultures containing L363-GFP (green) and MSC/EPCs (unstained). DiD labeled intermediate or large liposomes (cyan) were added to the medium for 48 hours. The scale bars represent 1 mm. (B) Confocal images showing 3D cocultures into which DiD labeled liposomes (small, intermediate, or large) were inserted (cyan). The liposomes were followed directly after insertion (0 hours), after 24 hours, and after 48 hours. The scale bars represent 500 µm. (C) Confocal images showing an overview of the entire 3D culture after 48 hours for all three liposome sizes. The scale bars represent 1,000 µm. (D) The presence of liposomes was quantified on all time points at the insertion site (I), the center of the 3D culture next to the insertion site (3D-C), the border of the 3D culture next to the medium (3D-B), and inside the medium (M). Data are presented as mean ± SD.
Abbreviations: EPCs, endothelial progenitor cells; MSCs, mesenchymal stromal cells.
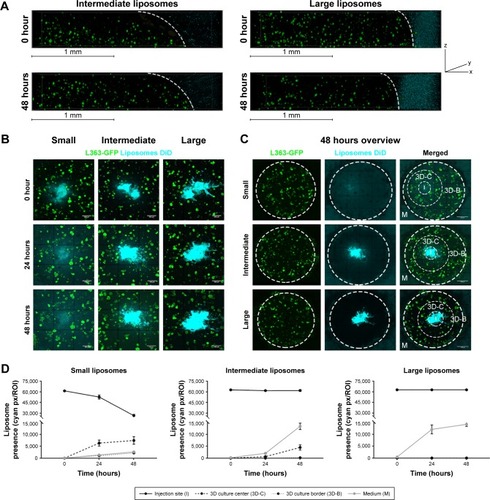
Figure 4 Intracellular uptake of liposomes, 48 hours after insertion.
Notes: (A) More intracellular uptake was observed in cultures with the small liposomes (~75 nm), compared with cultures with the intermediate (~100 nm) and large liposomes (~180 nm). Intracellular liposome uptake is present both in the small and intermediate liposome plugs. Data are presented as mean ± SD. *P<0.05, **P<0.01. (B) Confocal images of intracellular liposomes in 3D, showing nuclei (DAPI, blue), f-actin (phalloidin, red), and liposomes (DiD, cyan). All cultures were washed extensively before imaging, to remove all noninternalized liposomes. The scale bars represent 200 µm.
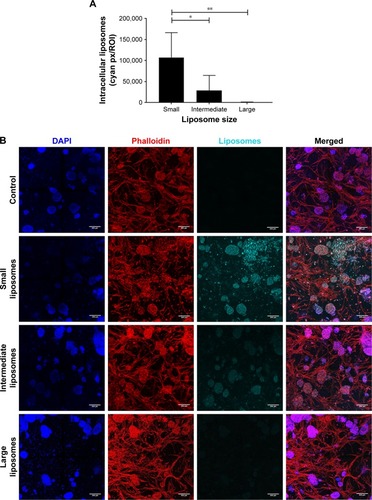
Figure 5 Enhanced liposomal uptake in myeloma cell clusters when using VLA-4 targeted liposomes.
Notes: (A) I. Confocal microscopy overview picture showing the regions that were quantified in each culture, I = insertion site. The scale bar represents 1,000 µm. II. Quantification of intracellular liposomes (~110 nm), in all regions, for both untargeted and VLA-4 targeted liposomes, 48 hours after insertion. All cultures were washed extensively before quantification, to remove all noninternalized liposomes. Data are presented as mean ± SD. **P<0.01, ***P<0.001. (B) Confocal images at the border of the plug, showing L363 cells (GFP, green), MSCs, and EPCs (DiD, red) and intracellular liposomes (rhodamine, cyan). The scale bars represent 150 µm.
Abbreviations: EPCs, endothelial progenitor cells; MSCs, mesenchymal stromal cells; VLA-4, very late antigen-4.
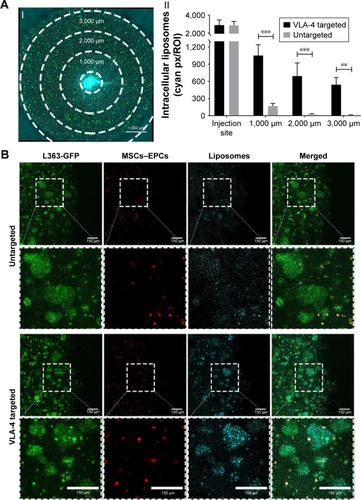
Figure 6 Free and liposomal chemotherapy tested in the 3D myeloma–BM model.
Notes: (A) Confocal overview pictures showing 3D cocultures 48 hours after treatment. MSCs, EPCs, and myeloma cells were visualized staining f-actin (phalloidin, red). The border of each plug is indicated by a white dashed circle. The insertion site of each culture is indicated by a dotted white circle. The scale bars represent 1,000 µm. Cultures were treated with doxorubicin (six left images) or bortezomib (six right images) both with free drug, untargeted liposomes, and VLA-4 targeted liposomes (both ~75 nm). Controls were taken along with no treatments or sham treatments (PBS or empty liposomes). (B) Quantification of viable myeloma cells, 48 hours after doxorubicin treatment and (C) bortezomib treatment. (D) Quantification of viable supporting cells, 48 hours after doxorubicin treatment and (E) bortezomib treatment. Data are presented as mean ± SD (n=3). **P<0.01, ***P<0.001.
Abbreviations: EPCs, endothelial progenitor cells; MSCs, mesenchymal stromal cells; VLA-4, very late antigen-4.
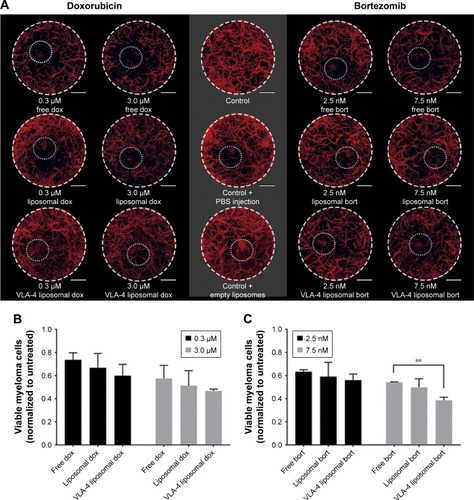
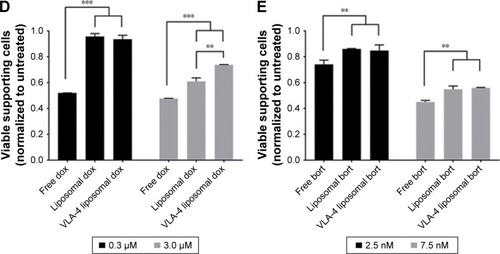
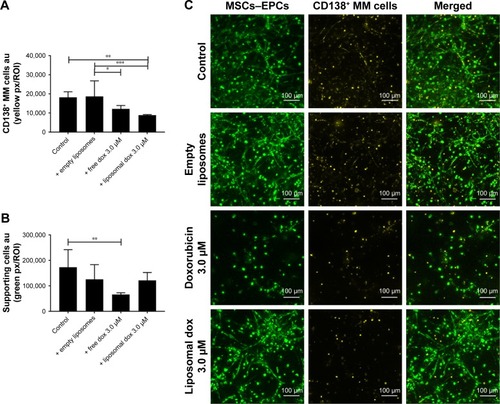
Figure 7 Free and liposomal doxorubicin tested on primary CD138+ myeloma cells cultured in the 3D BM model.
Notes: (A) Quantification of primary CD138+ myeloma cells, 48 hours after doxorubicin treatment. (B) Quantification of supporting cells, 48 hours after doxorubicin treatment. Data are presented as mean ± SD (n=2). *P<0.05, **P<0.01, ***P<0.001. (C) Confocal images of the 3D cocultures 48 hours after treatment, showing MSCs/EPCs (green) and primary CD138+ myeloma cells (yellow). The scale bars represent 100 µm.
Abbreviations: EPCs, endothelial progenitor cells; MSCs, mesenchymal stromal cells.