Figures & data
Table 1 Evaluation criteria of cytotoxicity
Table 2 Primer sequences
Figure 1 The characterization of nPLGA.
Notes: Malvern Zetasizer 3000HS size measurement of nPLGA (A). TEM images of nPLGA (B). Zeta potential of nPLGA (C).
Abbreviations: nPLGA, poly(lactic-co-glycolic acid) nanoparticles; TEM, transmission electron microscopy.
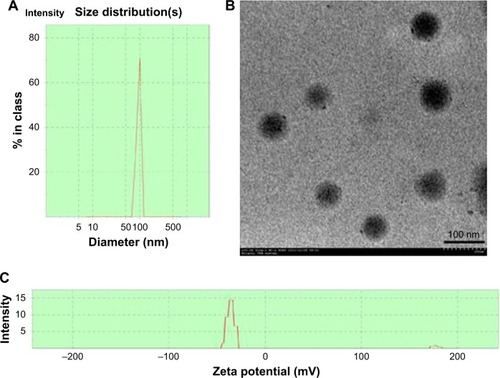
Figure 2 The characterization of nCS.
Notes: Malvern Zetasizer 3000HS size measurement of nCS (A). TEM images of nCS (B). Zeta potential of nCS (C).
Abbreviations: nCS, chitosan nanoparticles; TEM, transmission electron microscopy.
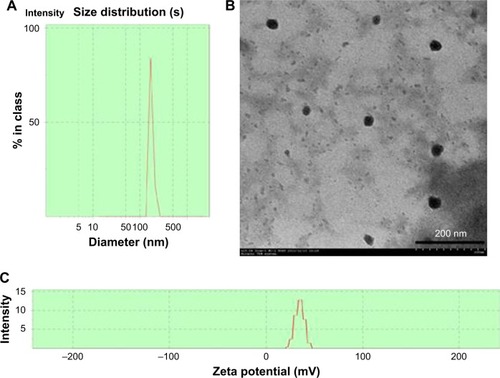
Table 3 Toxicity grading of nPLGA for hPDLCs
Table 4 Toxicity grading of nCS for hPDLCs
Table 5 Toxicity grading of nAg for hPDLCs
Figure 3 Effect of nPLGA, nCS, and nAg on the proliferation of hPDLCs.
Notes: Effect of nPLGA (A). Effect of nCS (B). Effect of nAg (C). The number stands for the corresponding concentration. *P<0.05.
Abbreviations: CS, chitosan; hPDLCs, human periodontal ligament cells; nAg, silver nanoparticles; nCS, CS nanoparticles; nPLGA, PLGA nanoparticles; PLGA, poly(lactic-co-glycolic acid).
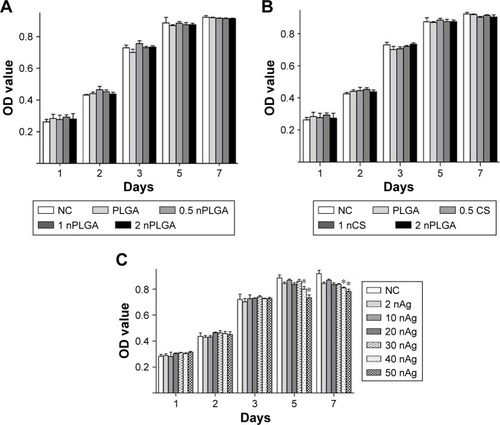
Figure 4 Alizarin Red S staining (×100).
Notes: nPLGA groups (A). nCS groups (B).
Abbreviations: CS, chitosan; nCS, CS nanoparticles; nPLGA, PLGA nanoparticles; PLGA, poly(lactic-co-glycolic acid).
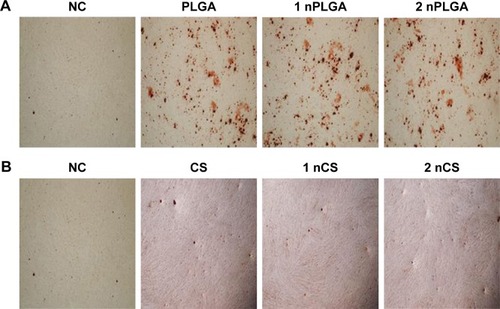
Figure 5 Real-time quantitative PCR analysis of the relative expression of osteogenic genes OCN, ALP, and OPN in hPDLCs cultured with different materials in osteogenic medium.
Notes: The relative mRNA expression of cells cultured with nPLGA groups (A–C) and cells cultured with nCS (D–F). *P<0.05.
Abbreviations: CS, chitosan; hPDLCs, human periodontal ligament cells; nCS, CS nanoparticles; nPLGA, PLGA nanoparticles; PLGA, poly(lactic-co-glycolic acid).
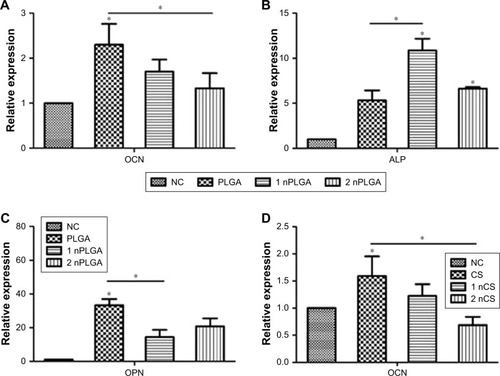
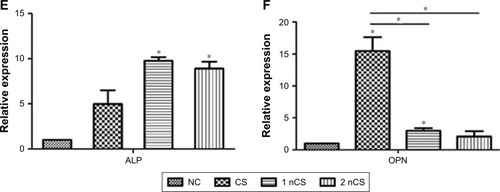
Figure 6 Antibacterial activity of different materials against Escherichia coli.
Notes: Inhibitory effect of nAg against E. coli (A). Inhibitory effect of CS and nCS against E. coli (B). The influence of nPLGA on the inhibitory effect of nAg and nCS against E. coli (C). AC (nAg+nCS); AP (nAg+nPLGA); CP (nCS+nPLGA); ACP (nAg+nCS+nPLGA).
Abbreviations: CS, chitosan; nAg, silver nanoparticles; nCS, CS nanoparticles; nPLGA, poly(lactic-co-glycolic acid) nanoparticles.
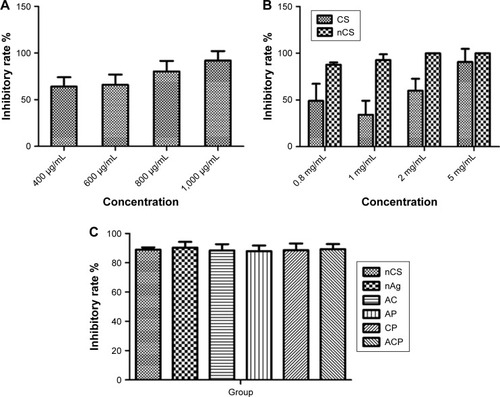
Table 6 Toxicity grading of nPLGA/nCS in different ratios for hPDLCs
Figure 7 Effect of nPLGA/nCS in different ratios on the proliferation of hPDLCs.
Abbreviations: hPDLCs, human periodontal ligament cells; nCS, chitosan nanoparticles; nPLGA, poly(lactic-co-glycolic acid) nanoparticles.
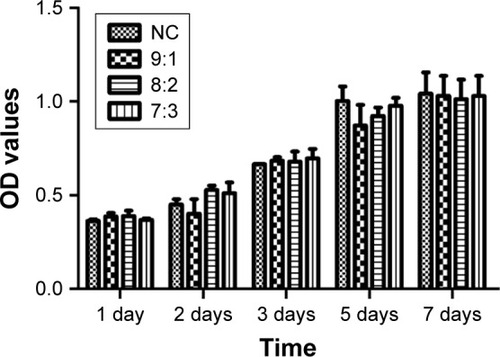
Figure 8 Alizarin Red S staining (×100).
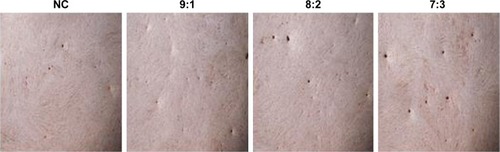
Figure 9 The relative mRNA expression of OCN, ALP, and OPN (*P<0.05, **P<0.01).
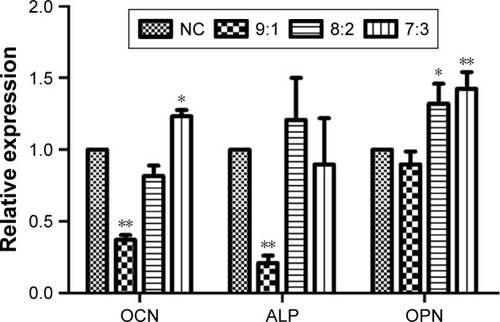
Table 7 Toxicity grading of nPLGA/nCS/nAg and PLGA/CS/nAg for hPDLCs (P<0.01)
Figure 10 Effect of nPLGA/nCS/nAg on the proliferation of hPDLCs compared with PLGA/CS/nAg.
Abbreviations: CS, chitosan; hPDLCs, human periodontal ligament cells; nAg, silver nanoparticles; nCS, CS nanoparticles; nPLGA, PLGA nanoparticles; PLGA, poly(lactic-co-glycolic acid).
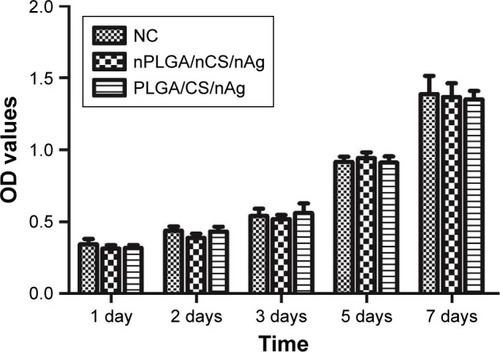
Figure 11 Alizarin Red S staining (×100).
Notes: NC (A). nPLGA/nCS/nAg (B). PLGA/CS/nAg (C).
Abbreviations: CS, chitosan; nAg, silver nanoparticles; nCS, CS nanoparticles; nPLGA, PLGA nanoparticles; PLGA, poly(lactic-co-glycolic acid).
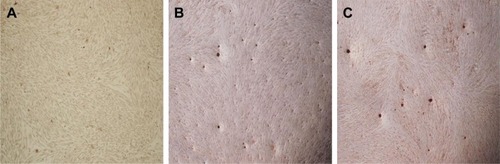
Figure 12 Real-time quantitative PCR analysis of the relative expression of osteogenic genes.
Note: *P<0.05.
Abbreviations: CS, chitosan; nAg, silver nanoparticles; nCS, CS nanoparticles; nPLGA, PLGA nanoparticles; PLGA, poly(lactic-co-glycolic acid).
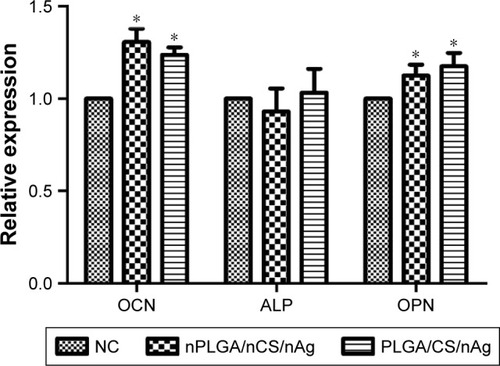
Figure 13 Analysis of bone defects.
Notes: Morphology of rabbit bone defect at 8 weeks (A). X-ray image of rabbit bone defect at 2 weeks (B). X-ray image of rabbit bone defect at 4 weeks (C). X-ray image of rabbit bone defect at 8 weeks (D). 1: negative control; 2: PLGA/CS/nAg group; and 3: nPLGA/nCS/nAg.
Abbreviations: CS, chitosan; nAg, silver nanoparticles; nCS, CS nanoparticles; nPLGA, PLGA nanoparticles; PLGA, poly(lactic-co-glycolic acid).
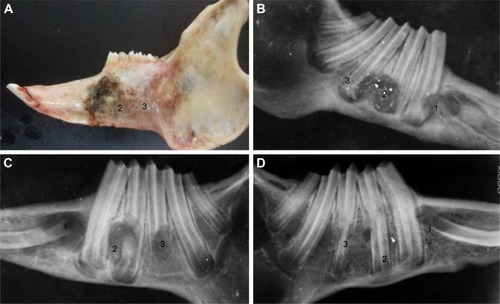
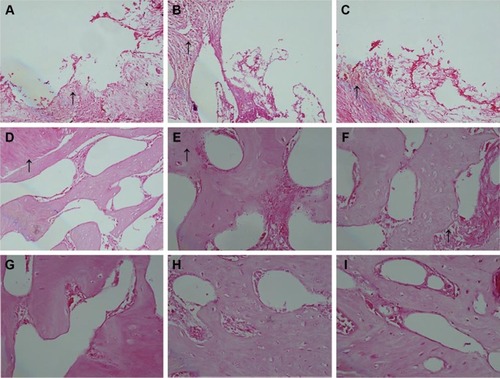
Figure 14 H&E staining at 2, 4, and 8 weeks.
Notes: 2 weeks: negative control (A), PLGA/CS/nAg group (B), and nPLGA/nCS/nAg group (C). 4 weeks: negative control (D), PLGA/CS/nAg group (E), and nPLGA/nCS/nAg group (F). 8 weeks: negative control (G), PLGA/CS/nAg group (H), and nPLGA/nCS/nAg group (I). The arrow points to the edge of the bone defect (×10).
Abbreviations: CS, chitosan; nAg, silver nanoparticles; nCS, CS nanoparticles; nPLGA, PLGA nanoparticles; PLGA, poly(lactic-co-glycolic acid).