Figures & data
Table 1 Treatments and survivals of different experimental mice groups
Figure 1 Structure, characterization, and toxicity of porous Se@SiO2 nanocomposites.
Notes: (A) Characterization of porous Se@SiO2 nanospheres: (a) XRD pattern of the porous Se@SiO2 nanospheres and standard hexagonal phase of Se (Joint Committee on Powder Diffraction Standards and no 65-1876). (b) TEM of porous Se@SiO2 nanospheres. (c) Low magnification and (d) high magnification images of porous Se@SiO2 nanospheres. (B) The influence of porous Se@SiO2 nanospheres on the viability of HK-2 cells was detected by a cell counting kit-8. Data were expressed as means ± SDs (n=3). Scr changes (C, D) and ALT changes (E, F) caused by different doses of porous Se@SiO2 nanospheres to mice were detected during 24 hours and 2 weeks. Data were expressed as means ± SDs (n=3).
Abbreviations: TEM, transmission electron microscopy; XRD, X-ray diffractometer; Scr, serum creatinine; ALT, alanine aminotransferase; ip, intraperitoneal dose.
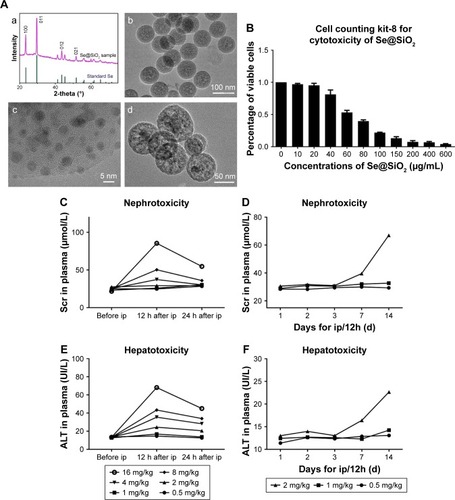
Figure 2 The level changes of ROS and GSH in HK-2 cells with different treatments.
Notes: (A) Staining of HK-2 cells with ROS, DAPI. Scale bars =20 µm. (B) Changes of ROS levels in HK-2 cells after different treatments of PBS or porous Se@SiO2 nanospheres. Data were expressed as means ± SDs (n=10). #P>0.05, *P<0.05 vs Ctrl + PBS group, **P<0.05, H/R + PBS vs H/R + Se@SiO2. (C) Changes of GSH levels in HK-2 cell supernatant after different treatments of PBS or porous Se@SiO2 nanospheres. #P>0.05, *P<0.05 vs Ctrl + PBS group, **P<0.05, H/R + PBS vs H/R + Se@SiO2. Data were expressed as means ± SDs (n=3).
Abbreviations: Ctrl, control; GSH, glutathione; H/R, hypoxia/reoxygenation.
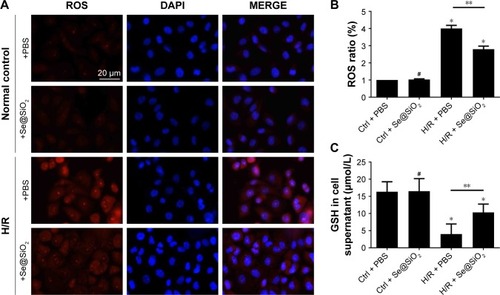
Figure 3 Cr/BUN levels in different groups of mice treated with saline or porous Se@SiO2 nanospheres.
Notes: (A, B) There was no significant difference of Cr/BUN levels between I/R + Se@SiO2 group and I/R + Se@SiO2 group 24 hours after I/R. #P>0.05. But the levels of Cr/BUN in I/R + Se@SiO2 group were decreased significantly compared to those in I/R + saline group from 3 days to 2 weeks after I/R. *P<0.05. Data were expressed as means ± SDs (n≥4).
Abbreviations: Cr, creatinine; BUN, blood urea nitrogen; I/R, ischemia/reperfusion.
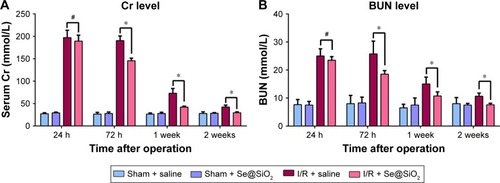
Figure 4 Histological analysis and apoptosis assessment for kidney tissues.
Notes: (A) Mouse kidney tissues stained with H&E. Scale bars =0.2 mm. (B) Tubular damage in outer medullary tissues from sham groups and I/R groups was semi-quantified using pathological scores. *P<0.05. Data were expressed as means ± SDs (n=10). (C) NGAL was detected in kidney tissues by immunohistochemistry. Scale bars =0.2 mm. (D) Positive NGAL area in outer medullary tissues from sham groups and I/R groups was semi-quantified using scores. *P<0.05. Data were expressed as means ± SDs (n=10). (E) Apoptosis cells in tissue were detected using a TUNEL kit. Scale bars =0.2 mm. (F) Statistical analysis of TUNEL staining. The numbers of TUNEL- positive cells of all cells in the field was calculated under a fluorescent microscope. *P<0.05. Data were expressed as means ± SDs (n=10).
Abbreviations: NGAL, neutrophil gelatinase-associated lipocalin; I/R, ischemia/reperfusion.
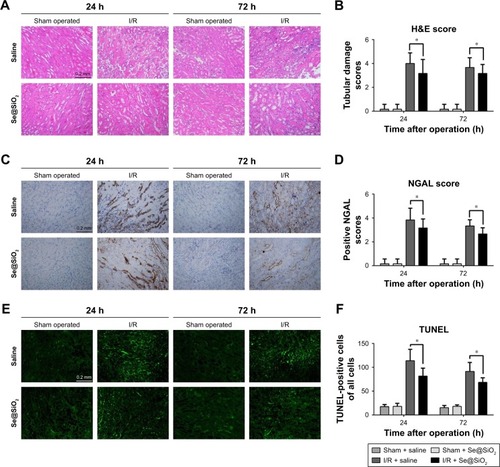
Figure 5 Expression changes of p-NF-κB/NLRP3/caspase-1 pathway and NGAL proteins with porous Se@SiO2 nanospheres intervention in vivo and in vitro.
Notes: (A, B) Expression of p-NF-κB/NLRP3/caspase-1 and NGAL protein in HK-2 cells was determined by Western blotting. *P<0.05, H/R + Se@SiO2 group vs H/R + PBS group. Data were expressed as means ± SDs (n=3). (C, D) Expression of p-NF-κB/NLRP3/caspase-1 and NGAL proteins in mouse kidney tissues was determined by Western blotting. *P<0.05, I/R + Se@SiO2 group vs sham + saline group. Data were expressed as means ± SDs (n=3).
Abbreviations: p-NF-κB, phosphorylated nuclear factor-κB; NLRP3, NACHT, LRR, and PYD domains-containing protein 3; NGAL, neutrophil gelatinase-associated lipocalin; I/R, ischemia/reperfusion; H/R, hypoxia/reoxygenation.
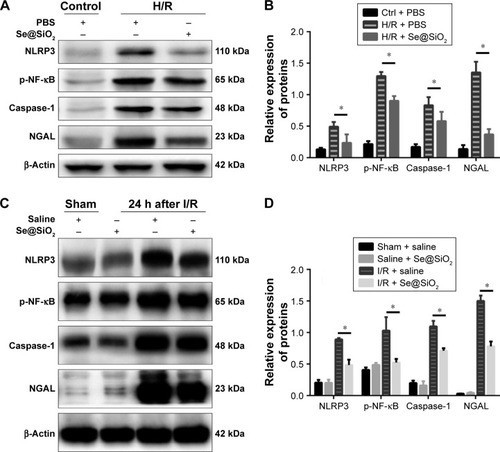
Figure 6 Changes of inflammation involving cytokines and macrophages after porous Se@SiO2 nanospheres treatment.
Notes: (A–C) The secretion levels of TNF-α, IL-1β, and MCP-1 in HK-2 cells supernatant as determined by Western blotting. *P<0.05 vs Ctrl + PBS group, **P<0.05, H/R + Se@SiO2 group vs H/R + PBS group. Data were expressed as means ± SDs (n=3). (D, E) Macrophage infiltration level in mouse kidney tissues was determined by immunohistochemistry for F4/80. *P<0.05, I/R + Se@SiO2 group vs I/R + saline group. Scale bars =0.2 mm. Data were expressed as means ± SDs (n=10).
Abbreviations: TNF-α, tumor necrosis factor-α; IL-1β, interleukin-1β; MCP-1, monocyte chemotactic protein-1; Ctrl, control; I/R, ischemia/reperfusion; H/R, hypoxia/reoxygenation.
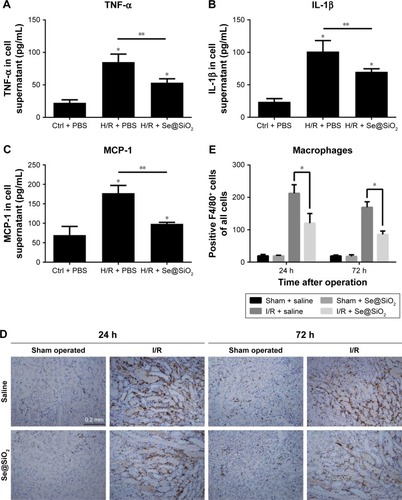
Figure 7 The effect of porous Se@SiO2 nanospheres on renal prognosis after AKI.
Notes: (A, B) The expression levels of collagen I and III and α-SMA protein in mouse kidney tissues 2 weeks after I/R-induced AKI as detected by Western blotting. *P<0.05, I/R-2w + Se@SiO2 group vs I/R-2w + saline group. Data were expressed as means ± SDs (n=3). (C) Renal histology H&E and fibrosis staining in 2 weeks after AKI. Scale bars =0.15 mm. Data were expressed as means ± SDs (n=10). (D) H&E tubule atrophy score was used to assess the severity of tubule atrophy after AKI. **P<0.05. Data were expressed as means ± SDs (n=10). (E–G) Masson trichrome staining, Sirius Red staining, and α-SMA immunohistochemical staining were used to assess the severity of renal fibrosis by proportion score. **P<0.05, I/R-2w + Se@SiO2 group vs I/R-2w + saline group. Data were expressed as means ± SDs (n=10).
Abbreviations: α-SMA, α-smooth muscle actin; GAPDH, glyceraldehyde-3-phosphate dehydrogenase; 2w, 2 weeks; I/R, ischemia/reperfusion; AKI, acute kidney injury.
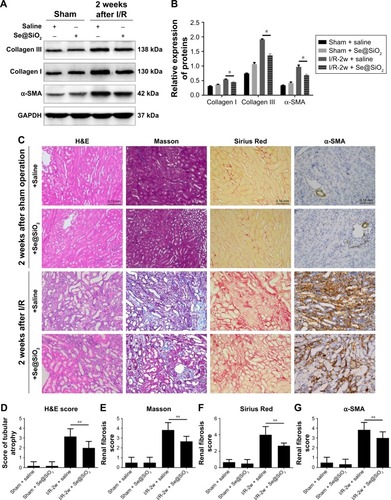
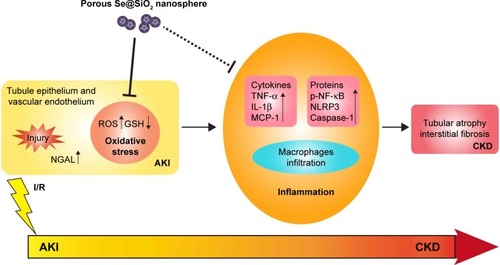
Figure 8 The description of porous Se@SiO2 nanospheres attenuating ischemic AKI injury and improving prognosis.
Note: Porous Se@SiO2 nanospheres attenuate ischemic AKI injury and improve prognosis by reducing the severity of injury in early AKI, resisting oxidative stress, relieving inflammation, and preventing further transition of AKI to CKD.
Abbreviations: AKI, acute kidney injury; GSH, glutathione; CKD, chronic kidney disease; TNF-α, tumor necrosis factor-α; IL-1β, interleukin-1β; MCP-1, monocyte chemotactic protein-1; p-NF-κB, phosphorylated nuclear factor-κB; NLRP3, NACHT, LRR, and PYD domains-containing protein 3; NGAL, neutrophil gelatinase-associated lipocalin.