Figures & data
Figure 1 (A) CD spectroscopy of peptides (VRF005 and VRF007) at two different temperatures, 4°C and 37°C. The experiments were performed in triplicate. (B) Native and SDS-PAGE of peptides (VRF005 and VRF007). (C) Zeta potential of peptides (VRF005 and VRF007). (D, E) Dynamic light scattering of peptides (VRF005 and VRF007) at different pH levels.
Abbreviation: CD, circular dichroism.
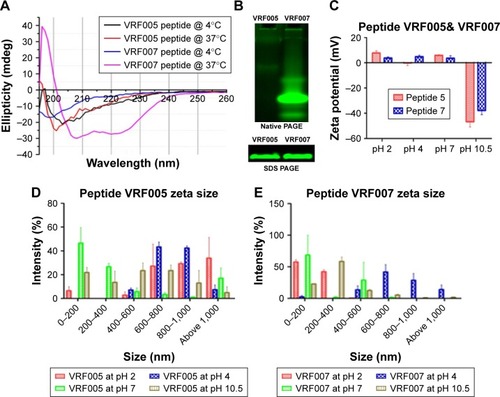
Figure 2 (A, B) Structural snapshots of MD simulations’ average thickness of lipid bilayer, and area per lipid measured with respect to time of peptide VRF005 at 0 ns, 300 ns, and 500 ns in the presence of POPC lipid bilayer. (C) Table showing the values of analysis of peptides in POPC membrane.
Abbreviations: MD, molecular dynamic; POPC, phosphatidylcholine.
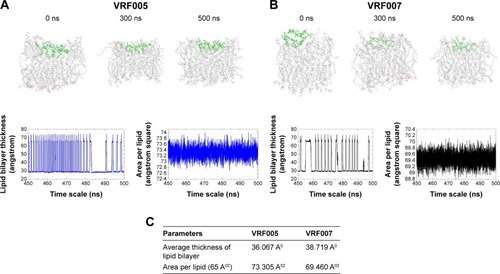
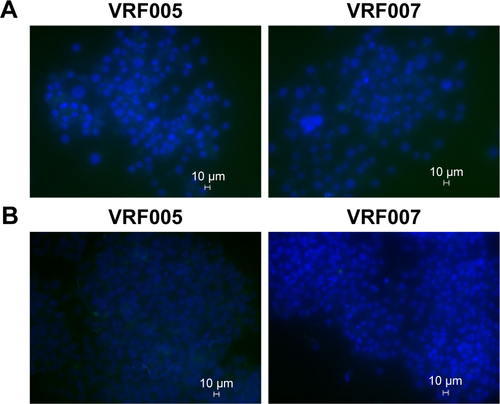
Figure 3 (A) Uptake of peptides, VRF005 and VRF007, at 1 µM concentration by primary corneal epithelial cells. FITC dextran was used as negative control. (B) VRF005 and VRF007 uptake at 1 µM concentration by NCC-RB51 cell line. (C) Peptide uptake, VRF005 and VRF007, by C. albicans at 1 µM concentration. (D) VRF005 uptake in F. solani.
Abbreviations: C. albicans, Candida albicans; FITC, fluorescein isothiocyanate; F. solani, Fusarium solani.
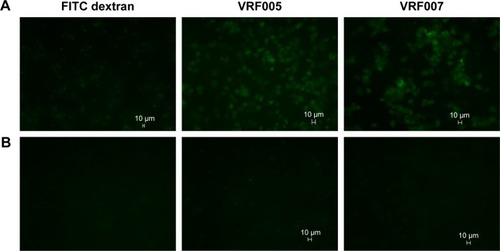
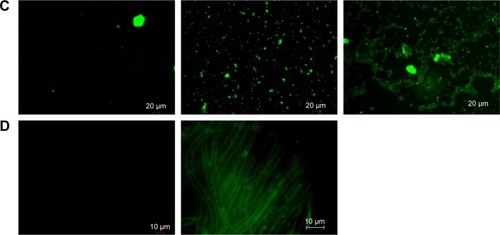
Figure 4 (A) CFU of C. albicans after treatment with different concentrations of peptides, VRF005 and VRF007 (1 µM, 2.5 µM, and 5 µM). Graphical representation of number of colonies formed after the treatment (B, C). Killing kinetics of peptides, VRF005 and VRF007, at 10 µM concentration at different time points for F. solani and C. albicans.
Abbreviations: C. albicans, Candida albicans; CFU, colony-forming unit; F. solani, Fusarium solani.
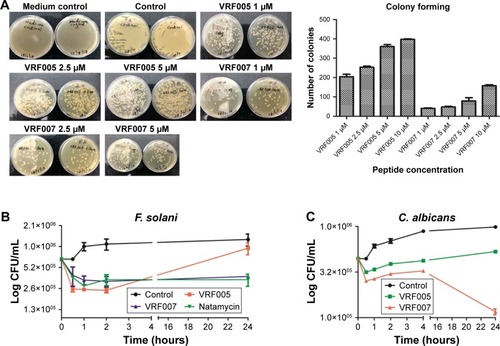
Figure 5 (A) Absorption spectroscopy of HG and SG hydrogels from 300 nm to 700 nm. (B) Swelling assay of HG and SG hydrogels with and without cross-linker. (C) Release of VRF005 with and without cross-linker from gelatin hydrogel. (D) Corneal epithelial cells on hard gel and soft gel.
Abbreviations: HG, hard gelatin; SG, soft gelatin.
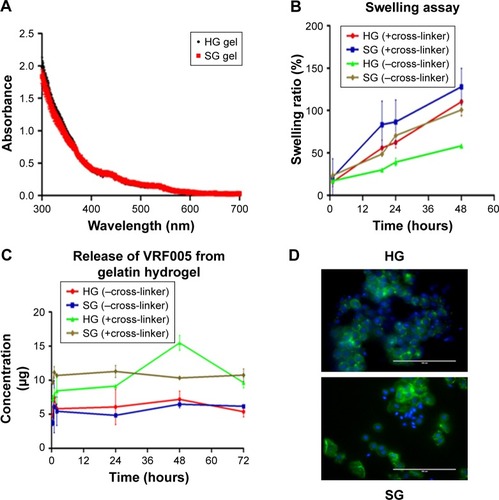
Figure 6 (A) SEM and pore size quantification of SG with and without VRF005. ***P<0.001. (B) FTIR spectroscopy SG hydrogel with and without peptide VRF005 cross-linking. (C) CD spectroscopy of gelatin and gelatin with peptides (VRF005). Time-killing kinetics of SG hydrogel with and without cross-linking peptide VRF005. (D) C. albicans. (E) F. solani.
Abbreviations: C. albicans, Candida albicans; CD, circular dichroism; CL, crosslinker; F. solani, Fusarium solani; FTIR, Fourier transform infrared; HG, hard gel; SEM, scanning electron microscopy; SG, soft gelatin.
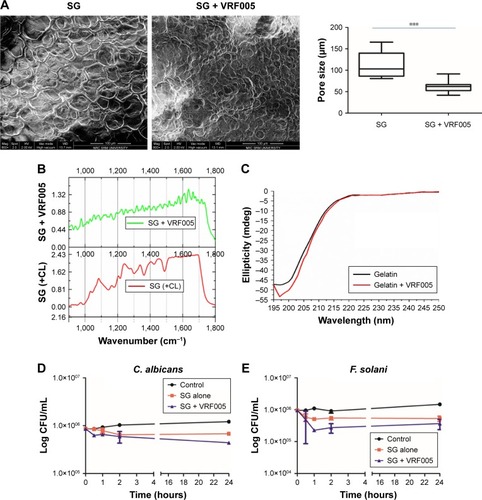
Figure S1 (A) Strategy for designing corneal-specific CPPs. (B) Physicochemical properties of the designed peptides.
Notes: aAPD-defined total hydrophobic ratio. bGRAVY. Greater positive score indicates greater hydrophobicity and vice versa.
Abbreviations: APD, antimicrobial peptide database; CPP, cell-penetrating peptide; GRAVY, grand average of hydropathicity.
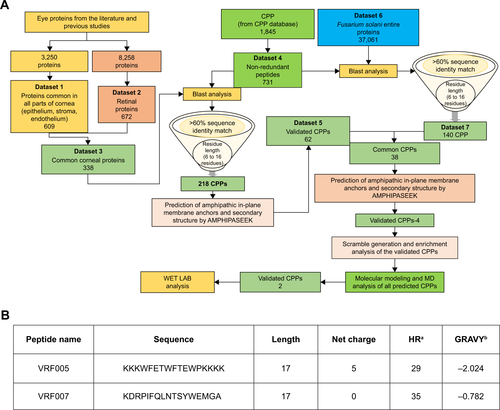
Figure S2 (A) VRF005: (i) structure obtained at the time frame of 100 ns; (ii) RMSD after a time frame of ~70 ns to 100 ns; (iii) Rg showing maximum compactness after a time frame of ~70 ns; (iv) RMSF fluctuation; and (v) secondary structure element graph. (B) VRF007: (i) structure obtained at the time frame of 100 ns; (ii) RMSD after a time frame of ~70 ns to 100 ns; (iii) Rg showing maximum compactness after a time frame of ~70 ns; (iv) RMSF fluctuation; and (v) secondary structure element graph.
Abbreviations: RMSD, root-mean-square deviation; RMSF, root-mean-square fluctuations.
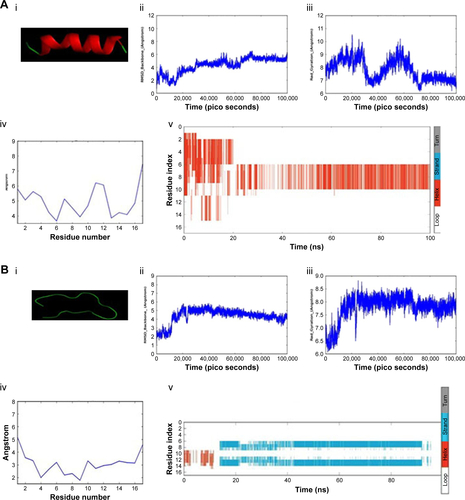
Figure S3 (A) Best model of peptide VRF005. (B) Procheck-generated Ramachandran plot (VRF005 named as Peptide _6).
Abbreviations: excl, excluding; Gly, glycine; Pro, proline.
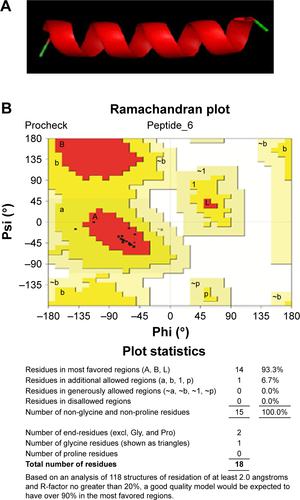
Figure S4 (A) Best model of peptide VRF007. (B) Procheck-generated Ramachandran plot (VRF007 named as Peptide _1).
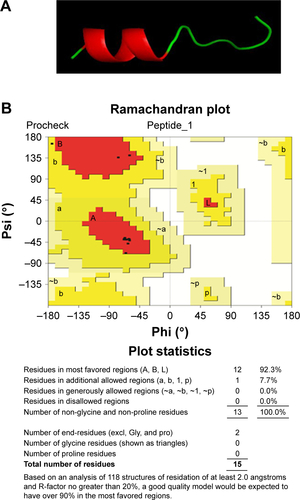
Figure S5 (A) SEM of tissues obtained during surgery. (B) Cell cycle analysis using PI and flow cytometry. (C) Immunoblotting of Claudin 1, ZO2, E-cadherin, and alpha catenin of cells isolated from tissues. (D) SDS-PAGE of peptides, VRF005 and VRF007, incubated with human corneal epithelial tissue lysate for 2 hours, lane 1, VRF007(1 µM); lane 2, VRF007(1 µM) with RIPA buffer; lane 3, VRF007 (1 µM) with 10 µg of tissue lysate; lane 4, VRF007(1 µM) with 20 µg of tissue lysate; lane 5, VRF007(1 µM) with 30 µg of tissue lysate; lane 6, VRF005 (1 µM) with 30 µg of tissue lysate; lane 7, VRF005(1 µM) with 20 µg of tissue lysate; lane 8, VRF005 (1 µM) with 10 µg of tissue lysate; lane 9, VRF005 (1 µM) with RIPA buffer; lane 10, VRF007 (1 µM) alone. (E) SDS-PAGE of peptides, VRF005 and VRF007, incubated with human corneal epithelial tissue lysate for 24 hours. (F) MTT assay for peptides, VRF005 and VRF007, at different concentrations for 24 hours.
Abbreviations: CECs, Corneal Epithelial cells; FITC, fluorescein isothiocyanate; PI, propidium iodide; SEM, scanning electron microscopy.
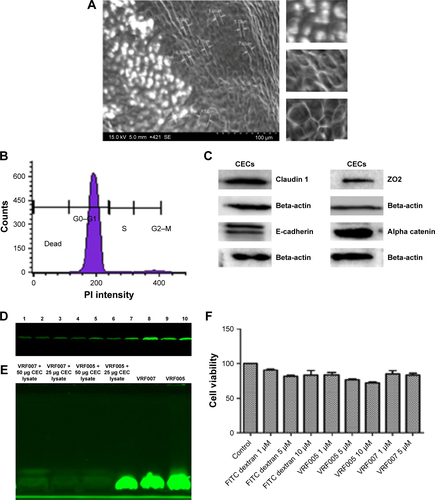
Figure S6 (A) Peptide, VRF005 and VRF007, uptake in MIOM (Muller glial cells) cell line, merged image. (B) Peptide, VRF005 and VRF007, uptake in MCF-7 cell line, merged image.