
Figures & data
Figure 1 Chemical structure of synthesized TPGS-DTPA.
Abbreviation: TPGS-DTPA, d-α-tocopherol polyethylene glycol 1000 succinate-diethylenetriaminepentaacetic acid.
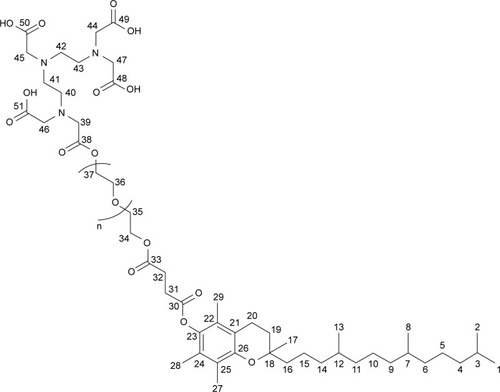
Figure 2 FTIR spectra of DTPA anhydride, TPGS and synthesized TPGS-DTPA.
Abbreviations: DTPA, diethylenetriaminepentaacetic acid; FTIR, Fourier-transform infrared spectroscopy; TPGS, d-α-tocopherol polyethylene glycol 1000 succinate.
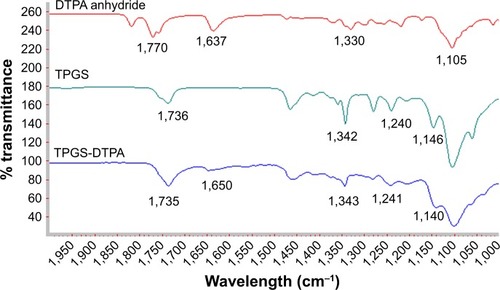
Figure 3 1H NMR spectra of (A) TPGS and (B) TPGS-DTPA synthesized via microwave technology.
Abbreviations: DTPA, diethylenetriaminepentaacetic acid; NMR, nuclear magnetic resonance; TPGS, d-α-tocopherol polyethylene glycol 1000 succinate.
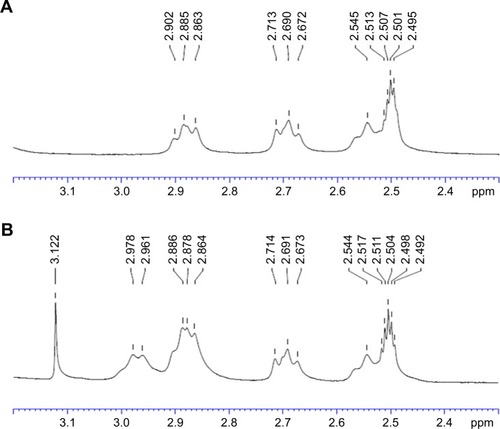
Figure 4 13C NMR spectra of (A) TPGS and (B) TPGS-DTPA synthesized via microwave technology.
Abbreviations: DTPA, diethylenetriaminepentaacetic acid; NMR, nuclear magnetic resonance; TPGS, d-α-tocopherol polyethylene glycol 1000 succinate.
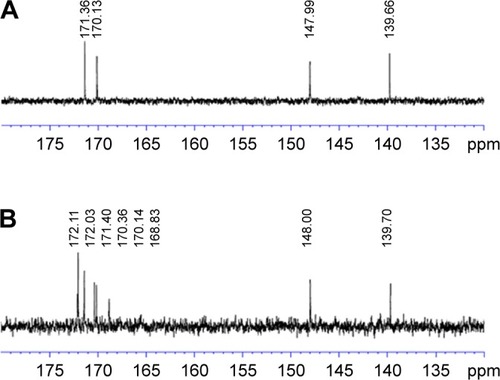
Table 1 Formulation of niosomes (expressed as molar ratio) and their corresponding particle size, PDI, and zeta potential
Table 2 Radiolabeling efficiency of 99mTc-labeled niosomes with increasing concentrations of TPGS-DTPA
Figure 5 TEM micrograph of niosomes (N3) at a magnification of 800×.
Abbreviation: TEM, transmission electron microscope.
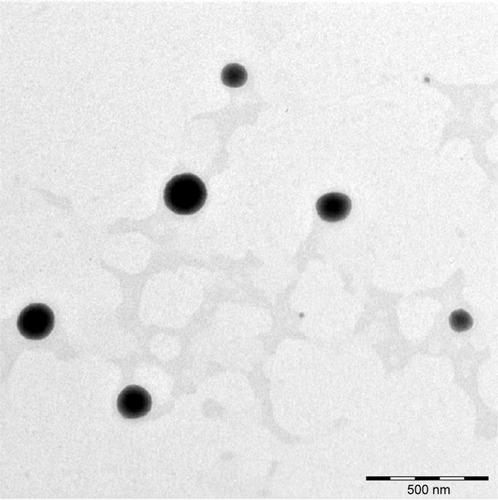
Figure 6 TEM micrograph and measurement of a single niosome (N3) at a magnification of 25,000×.
Abbreviation: TEM, transmission electron microscope.
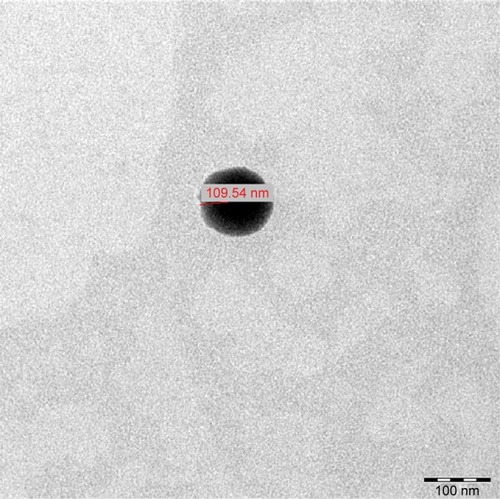
Table 3 The effect of varying concentrations of SnCl2·H2O on the radiolabeling efficiency of 99mTc-labeled niosomes (N3)
Table 4 The effect of varying pH on the radiolabeling efficiency of 99mTc-labeled niosomes (N3)
Figure 7 The effect of incubation time on the radiolabeling efficiency of 99mTc-labeled niosomes (N3).
Note: Data presented as mean ± SD.
Abbreviation: 99mTc, Technetium-99m.
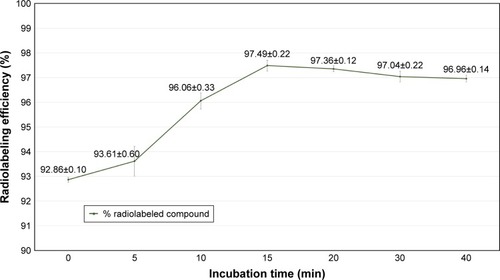
Figure 8 Stability of 99mTc-labeled niosomes (N3) in saline and serum in vitro at 37°C.
Note: Data presented as mean ± SD. (n= mean ± SD).
Abbreviation: 99mTc, Technetium-99m.
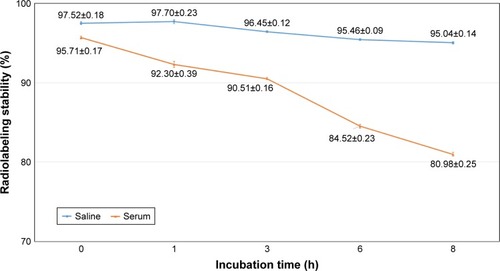
Figure S1 Full range FTIR spectra (400–4,000 cm−1) of DTPA anhydride, TPGS, and synthesized TPGS-DTPA.
Abbreviations: DTPA, diethylenetriaminepentaacetic acid; FTIR, Fourier-transform infrared spectroscopy; TPGS, d-α-tocopherol polyethylene glycol 1000 succinate.
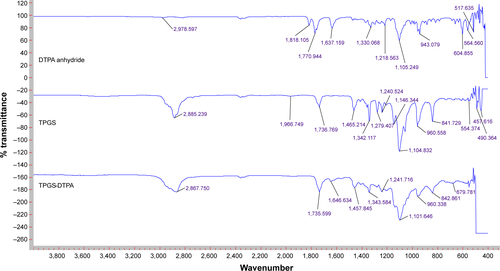
Figure S2 1H NMR spectrum (0–2.4 ppm) of TPGS.
Abbreviations: NMR, nuclear magnetic resonance; TPGS, d-α-tocopherol polyethylene glycol 1000 succinate.
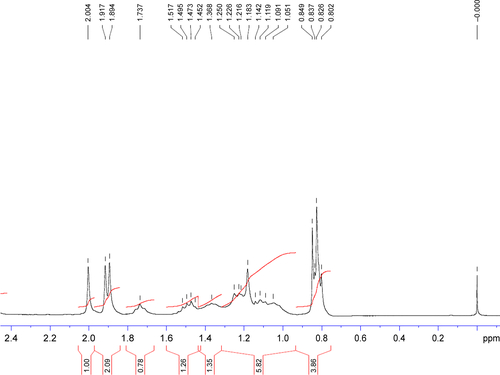
Figure S3 1H NMR spectrum (2–4.4 ppm) of TPGS.
Abbreviations: NMR, nuclear magnetic resonance; TPGS, d-α-tocopherol polyethylene glycol 1000 succinate.
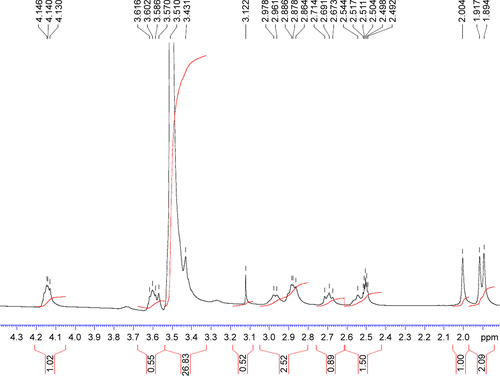
Figure S4 1H NMR spectrum (0–5 ppm) of synthesized TPGS-DTPA.
Abbreviations: NMR, nuclear magnetic resonance; TPGS-DTPA, d-α-tocopherol polyethylene glycol 1000 succinate-diethylenetriaminepentaacetic acid.
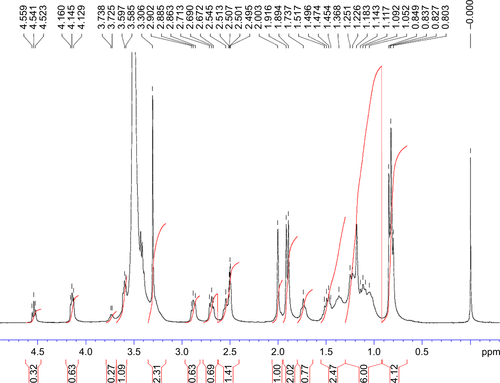
Figure S5 13C NMR spectrum (0–180 ppm) of TPGS.
Abbreviations: NMR, nuclear magnetic resonance; TPGS, d-α-tocopherol polyethylene glycol 1000 succinate.
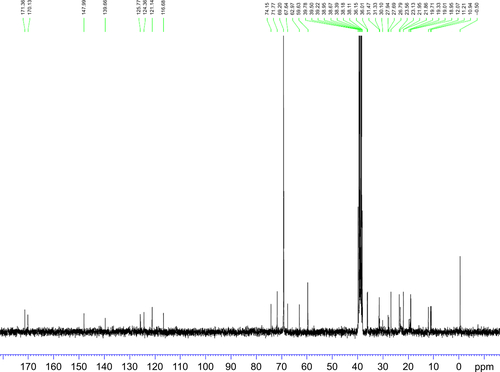
Figure S6 13C NMR spectrum (0–180 ppm) of synthesized TPGS-DTPA.
Abbreviations: NMR, nuclear magnetic resonance; TPGS-DTPA, d-α-tocopherol polyethylene glycol 1000 succinate-diethylenetriaminepentaacetic acid.
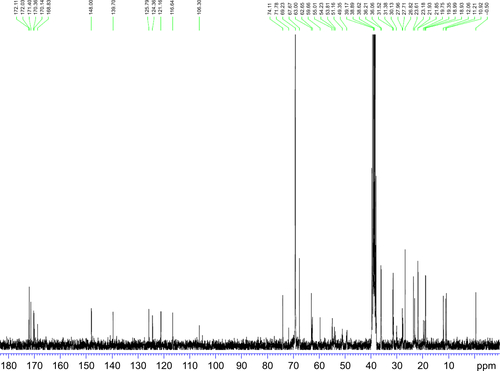
Table S1 Effect of increasing probe sonication times on particle size and PDI of niosomes (N3)
Table S2 The effect of temperature on radiolabeling efficiency
Table S3 Effect of increasing probe sonication times on particle size and PDI of niosomes (N3)