Figures & data
Figure 1 Research design.
Notes: Synthesis and internalization of Fe3O4 @PDA and Fe3O4. Rats with inflammation in the right ear received 106 MSCs labeled with Fe3O4@PDA or Fe3O4 via the tail vein.
Abbreviations: Fe3O4@PDA, PDA-capped Fe3O4; MSC, mesenchymal stem cell; PDA, polydopamine.
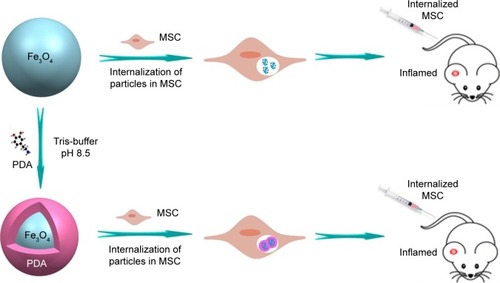
Table 1 Primer sequences and product sizes
Figure 2 TEM image and size distribution of iron oxide nanoparticles.
Notes: (A and C) are TEM images of representative 100 µg/mL Fe3O4@PDA and Fe3O4 nanoparticles, respectively. (B and D) are the size distribution of Fe3O4@PDA and Fe3O4 nanoparticles, respectively.
Abbreviations: Fe3O4@PDA, PDA-capped Fe3O4; PDA, polydopamine; TEM, transmission electron microscopy.

Figure 3 Iron oxide nanoparticle internalization by MSCs.
Notes: Different concentrations of nanoparticles (0, 25, 50, 100, and 150 µg/mL) were labeled MSCs for 16 hours to determine the optimal labeling efficiency. (A) Then MSCs were stained with a Prussian blue iron stain kit. The scale bar is 100 µm. (B) Iron concentration was determined by ICP-OES. (C) TEM image of nanoparticles (50 µg/mL) internalized in a MSC. The scale bar is 5 µm. The red arrows indicate that nanoparticles were observed in the cell cytoplasm.
Abbreviations: Fe3O4@PDA, PDA-capped Fe3O4; PDA, polydopamine; ICP-OES, inductively coupled plasma optical emission spectrometer; MSC, mesenchymal stem cell; TEM, transmission electron microscopy.
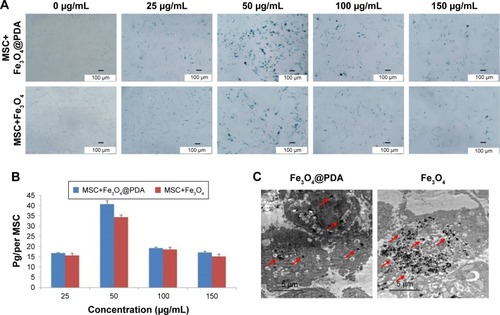
Figure 4 Characterization of MSCs was not influenced by iron oxide nanoparticles.
Notes: A total of 50 µg/mL nanoparticles were labeled MSCs for 16 hours. (A) FACS analysis of MSC-labeled iron oxide nanoparticles showed that they were negative for CD45 and CD34, and strongly expressed typical surface antigens, such as CD44 and CD90. (B) Differentiation of MSC-labeled iron oxide nanoparticles: cultured in appropriate differentiation media, MSCs differentiated into adipocytes or osteoblasts. All exhibited adipogenic and osteogenic differentiation potential similar to that of control MSCs.
Abbreviations: FACS, fluorescence-activated cell sorting; Fe3O4@PDA, PDA-capped Fe3O4; PDA, polydopamine; MSC, mesenchymal stem cell.
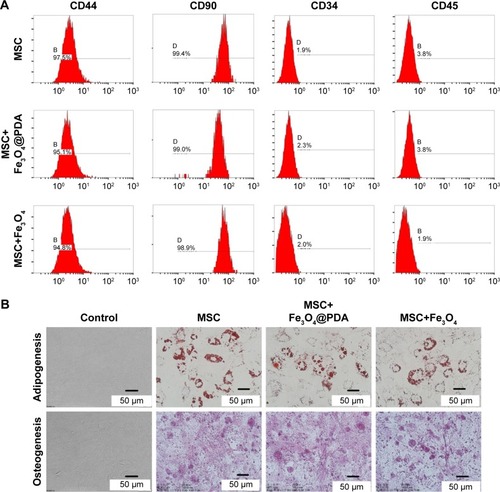
Figure 5 Proliferation and viability of MSCs are not affected by nanoparticle labeling.
Notes: Cell viability assay was observed in MSCs labeled with different concentrations (0, 25, 50, 75, 100, 150, or 200 µg/mL) of nanoparticles for 24 hours. (A) Proliferation of 50 µg/mL nanoparticle-labeled MSCs was assessed after 5 days by CCK-8. (B) In vitro CFU assays are usually used to detect the proliferation and differentiation features of MSCs. A colony was defined as an aggregate of >40 cells. (C) CFU colonies of MSC-labeled nanoparticles (50 µg/mL) were stained with Giemsa stain, (D) and the number of colonies was counted.
Abbreviations: CCK-8, cell counting kit-8; CFU, colony-forming unit; Fe3O4@PDA, PDA-capped Fe3O4; PDA, polydopamine; MSC, mesenchymal stem cell.
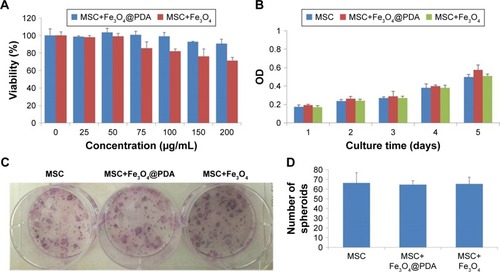
Figure 6 Uptake of iron oxide nanoparticles did not induce apoptosis but increased MSC SPF and PIndex.
Notes: MSCs were cultured for 16 hours in the presence or absence of 50 µg/mL iron oxide nanoparticles. At harvest, the MSCs were stained with antibodies to annexin V and PI, and analyzed by flow cytometry. (A) The FACS plots were representative of one of the three experiments. The DNA content of the MSCs was measured by PI staining using flow cytometry. (B) The FACS plots were representative of one of the three experiments. (C) The SPF and PIndex of three independent experiments were averaged. Bar represent the SD. *P<0.05 and ***P<0.001, vs the MSCs group.
Abbreviations: FACS, fluorescence-activated cell sorting; Fe3O4@PDA, PDA-capped Fe3O4; PDA, polydopamine; PI, propidium iodide; PIndex, proliferation index; MSC, mesenchymal stem cell; SPF, S-phase fraction.
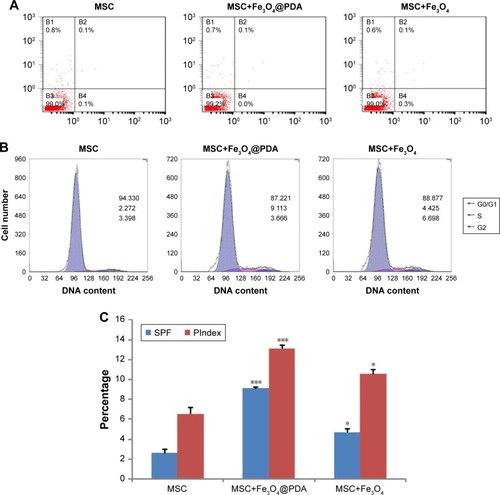
Figure 7 Cytokine release of MSCs labeled with iron oxide nanoparticles.
Notes: The MSCs were labeled with 50 µg/mL iron oxide nanoparticles for 16 hours. And MSC alone cultures were collected at the time points of 24, 72, and 120 hours. Standard cell culture medium served as a control. (A) VEGF and (B) TGF-β concentrations were measured by ELISA. Bar represent the SD. ***P<0.001, vs the MSCs group.
Abbreviations: Fe3O4@PDA, PDA-capped Fe3O4; PDA, polydopamine; MSC, mesenchymal stem cell; VEGF, vascular endothelial growth factor.
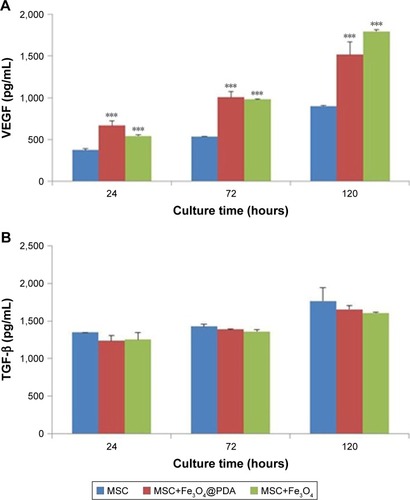
Figure 8 Effect of nanoparticle exposure on MSC migration in vitro.
Notes: The migration of MSCs labeled with 50 µg/mL nanoparticles for 16 hours. (A) Schematic illustration of the Transwell assay. (B) The migratory capacity after nanoparticle labeling is displayed as the histogram of the ratio of migrated cells. Bar represent the SD. ***P<0.001, vs the MSCs group. (C) MSCs passed through the inserts were dyed by H&E. Scale bar =20 µm.
Abbreviations: Fe3O4@PDA, PDA-capped Fe3O4; H&E, hematoxylin and eosin; PDA, polydopamine; MSC, mesenchymal stem cell.
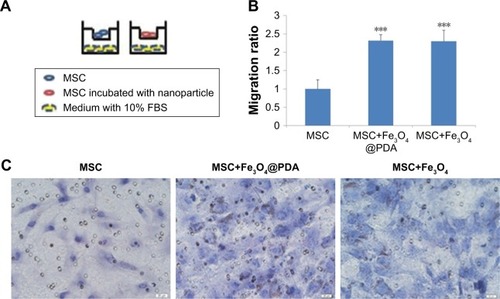
Figure 9 Expression of migration-related genes analyzed by qRT-PCR and Western blot.
Notes: The mRNA level of migration-related genes from the MSCs labeled with 50 µg/mL iron oxide nanoparticles for 16 hours was measured by qRT-PCR. (A) The column charts represent the qRT-PCR data. The data are presented as the mean ± SD from three independent experiments. ***P<0.001 when compared to MSCs. (B) MSCs which were labeled with 50 µg/mL iron oxide nanoparticles for 16 hours expressed protein level of migration-related genes. 1 represents MSCs group; 2 represents MSCs labeled with Fe3O4@PDA group; 3 represents MSCs labeled with Fe3O4 group.
Abbreviations: CCR1, C-C motif receptor 1; c-Met, cellular-mesenchymal to epithelial transition factor; CXCR4, C-X-C chemokine receptor 4; Fe3O4@PDA, PDA-capped Fe3O4; PDA, polydopamine; MSC, mesenchymal stem cell; qRT, quantitative reverse transcription.
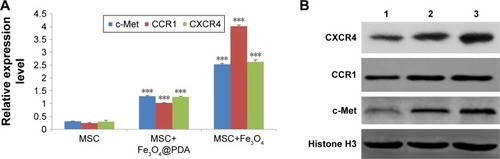
Figure 10 Reduction of inflammation following nanoparticle-treated MSC administration.
Notes: (A) Histological analysis of ear tissues (scale bars: 100 µm). The sections showed an alteration of tissue architecture in the inflamed ears and in the ones treated with MSCs. (B) Prussian blue analysis of ear sections at 24 hours reveals that iron oxide nanoparticles stayed at ear tissues. Scale bars: 100 µm. Moreover, nanoparticles treatment enhanced the recruitment of MSCs in the inflamed ear. (C) Nanoparticles labeled MSCs exhibited a significant addition in ear compared to the other groups. Scale bars: 20 µm. (D) qRT-PCR for the expressions of pro-(TNF-α and COX-2) and anti-(TGF-β and IL-10) inflammatory genes on explants 24 hours following the injection of MSCs labeled with iron oxide nanoparticles and unlabeled MSCs. The expression levels of pro-inflammatory molecules found in the inflamed ears are also shown for control ear with no inflammation. (n=3; bar represent the SD. *P<0.05, **P<0.01, and ***P<0.001). 1 represents normal ear with no inflammation; 2 represents inflamed ears injected with PBS; 3 represents inflamed ears injected with MSC; 4 represents inflamed ears injected with MSCs labeled with Fe3O4@PDA; and 5 represents inflamed ears injected with MSCs labeled with Fe3O4.
Abbreviations: COX-2, cyclooxygenase-2; Fe3O4@PDA, PDA-capped Fe3O4; IL-10, interleukin-10; PDA, polydopamine; MSC, mesenchymal stem cell; qRT, quantitative reverse transcription; TNF-α, tumor necrosis factor-α.
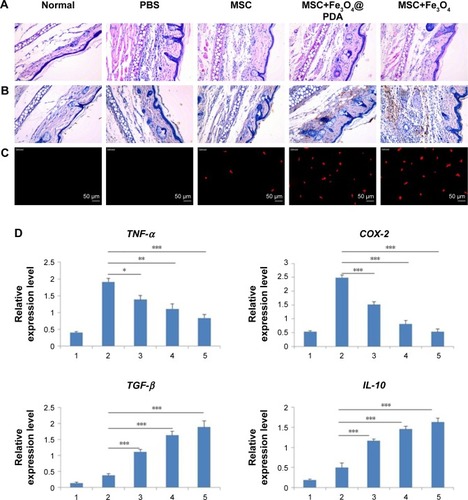
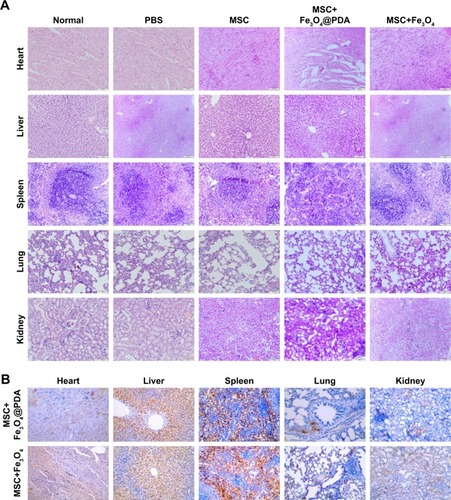
Figure 11 The rat’s major organ slices 24 hours after the injection of nanoparticle-labeled MSCs were stained using (A) H&E and (B) Prussian blue. The scale bar is 100 µm.
Abbreviations: Fe3O4@PDA, PDA-capped Fe3O4; H&E, hematoxylin and eosin; PDA, polydopamine; MSC, mesenchymal stem cell.