Figures & data
Table 1 Real-time polymerase chain reaction primers used in this study
Figure 1 Sample characterization.
Notes: (A) TEM image of αFeNPs. (B) Hysteresis loops of αFeNPs and αFe-ES, indicating weak superparamagnetism of αFeNPs, and non-magnetism of αFe-ES. (C) Photos of fabricated αFe-ES with assembled nanoparticles and the untreated ES control.
Abbreviations: αFeNP, hydrophilic hematite nanoparticle; αFe-ES, αFeNPs-assembled electrospun scaffold; ES, untreated electrospun scaffold; TEM, transmission electron microscopy.
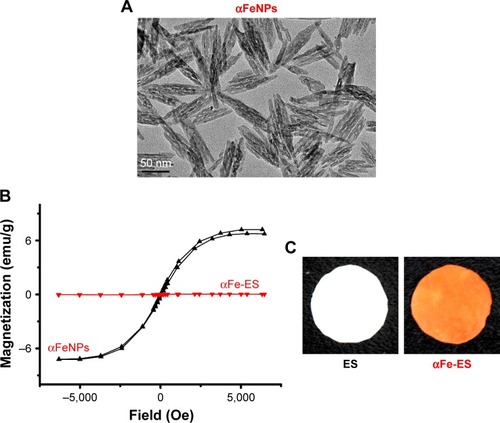
Table 2 Main parameters of the hematite nanoparticles used in the present study (mean±SD)
Figure 2 SEM (A–D) and TEM (E, F) images of the scaffolds: ES Control (A, C, E); αFe-ES (B, D, F).
Note: The images present the morphology of the nano assemblies on the outer surface of the electrospun scaffolds.
Abbreviations: αFeNP, hydrophilic hematite nanoparticle; αFe-ES, αFeNPs-assembled electrospun scaffold; ES, untreated electrospun scaffold; SEM, scanning electron microscopy; TEM, transmission electron microscopy.
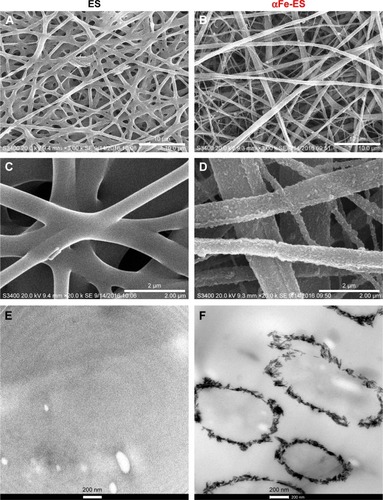
Figure 3 AFM images of ES and αFe-ES. Two-dimensional AFM images of ES (A), and αFe-ES (B). Three-dimensional AFM reconstruction of ES (C) and αFe-ES (D).
Abbreviations: αFeNP, hydrophilic hematite nanoparticle; αFe-ES, αFeNPs-assembled electrospun scaffold; AFM, atomic force microscopy; ES, untreated electrospun scaffold.
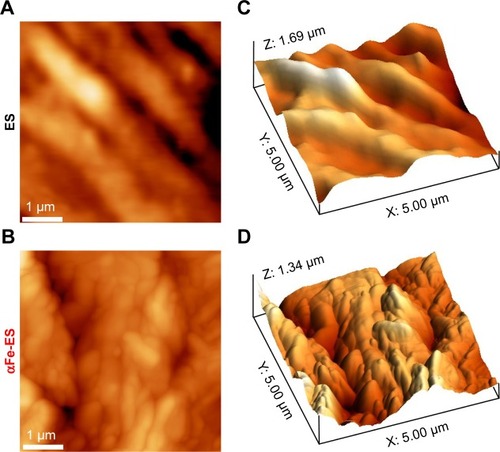
Figure 4 Physical and surface properties of the scaffolds (ES control and αFe-ES). (A) Representative deflection-distance curves of the electrospun scaffolds. (B) Young’s modulus of ES and αFe-ES by nano indentation (n=4). (C) TGA results of the samples’ weight loss during thermal treatment. (D) XPS spectra of the two groups. (E) Water contact angles of the two groups. (F) Measurements of protein adsorption (n=9).
Note: **P<0.01.
Abbreviations: αFeNP, hydrophilic hematite nanoparticle; αFe-ES, αFeNPs-assembled electrospun scaffold; ES, untreated electrospun scaffold; TGA, thermogravimetric analysis; XPS, X-ray photoelectron spectroscopy.
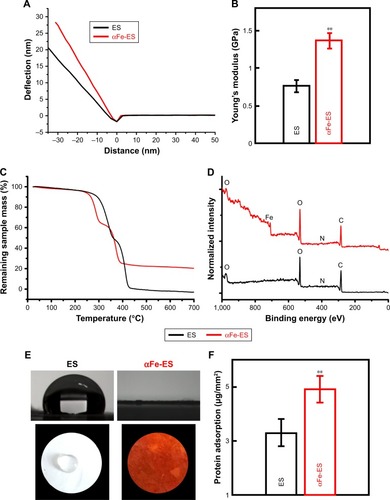
Table 3 Elemental surface composition (in atomic percentage (%)) of the ES and αFe-ES determined by XPS (mean±SD, three measurements).
Figure 5 Confocal laser scanning microscopy images (×400) of morphology of ADSCs cultured on the scaffolds (ES control and αFe-ES) at 6 hours (A, B) and 24 hours (C, D). Cells were stained for F-actin (red) and the nucleus (blue). (E) Quantitative analysis of adhered cell ratio at 6 hours. (F) Quantitative analysis of cell spreading area at 6 hours.
Note: **P<0.01.
Abbreviations: ADSC, adipose-derived stem cell; αFeNP, hydrophilic hematite nanoparticle; αFe-ES, αFeNPs-assembled electrospun scaffold; ES, untreated electrospun scaffold.
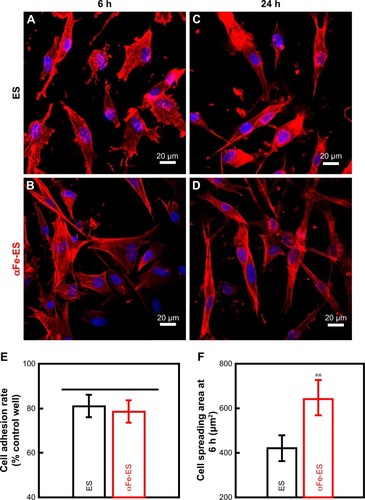
Figure 6 Cell morphology and ALP activity of ADSCs cultured on the scaffolds. Cell morphology on the scaffolds by SEM at 2 days after seeding on ES (A) and αFe-ES (B). (C) Cell proliferation on ES and αFe-ES. (D) ALP activities of seeded cells at 4, 7, and 14 days after seeding (n=4).
Note: *P<0.05, **P<0.01.
Abbreviations: αFeNP, hydrophilic hematite nanoparticle; αFe-ES, αFeNPs-assembled electrospun scaffold; ADSC, adipose-derived stem cell; ALP, alkaline phosphatase; ES, untreated electrospun scaffold; OD, optical density; SEM, scanning electron microscopy.
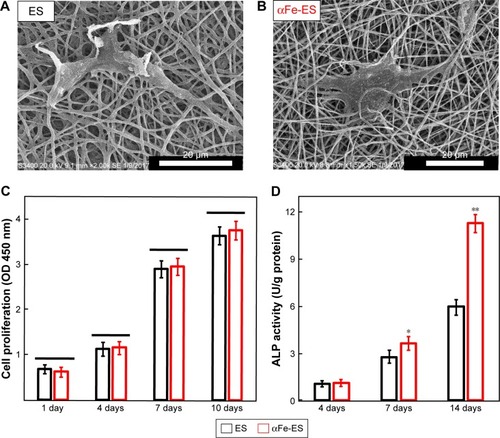
Figure 7 Osteogenic gene expression and mineral synthesis of ADSCs on the scaffolds. (A–D) The expressions of Alp, Col1, Runx2, and Ocn on the scaffolds after 7 days and 14 days of culture (n=4). (E) Quantitative analysis of mineral synthesis by the cells after 14 days and 21 days of culture (n=6). (F) The expressions of Isca1 on the scaffolds after 7 days and 14 days of culture (n=4).
Note: **P<0.01.
Abbreviations: αFeNP, hydrophilic hematite nanoparticle; αFe-ES, αFeNPs-assembled electrospun scaffold; ADSC, adipose-derived stem cell; Alp, alkaline phosphatase; Col1, collagen type I; ES, untreated electrospun scaffold; Isca1, iron-sulfur cluster assembly protein 1; Ocn, osteocalcin; Runx2, runt related transcription factor 2.
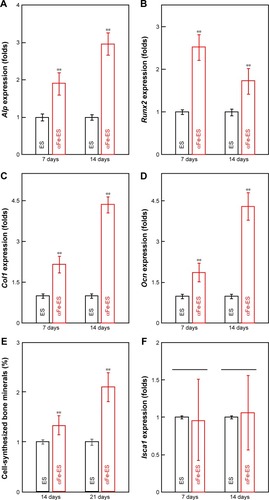
Figure 8 The nano interface provided better adhesion sites for the cells. High magnification TEM images of ADSCs after 7 days’ culture on the scaffolds, (A and C) ES, (B and D) αFe-ES. A few αFeNPs were seen inside the cells.
Abbreviations: αFeNP, hydrophilic hematite nanoparticle; αFe-ES, αFeNPs-assembled electrospun scaffold; ADSC, adipose-derived stem cell; ES, untreated electrospun scaffold; TEM, transmission electron microscopy.
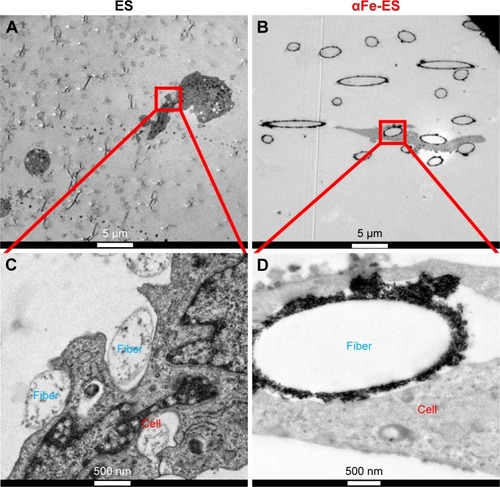
Figure 9 Schematic illustration of the mechanisms for enhancing osteogenic differentiation of ADSCs using electrospun scaffolds with assemblies of functional IONP through the LbL process.
Abbreviations: αFeNP, hydrophilic hematite nanoparticle; ADSC, adipose-derived stem cell; IONP, iron oxide nanoparticle; LbL, Layer-by-Layer.
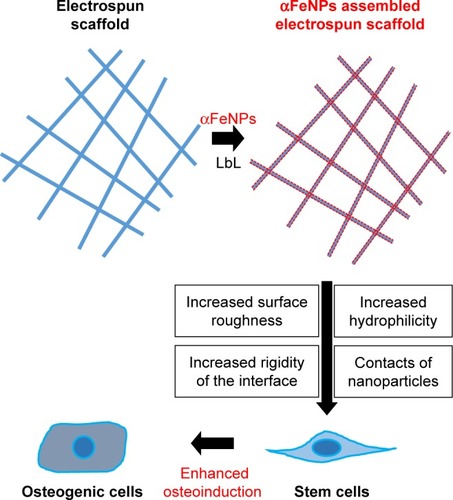
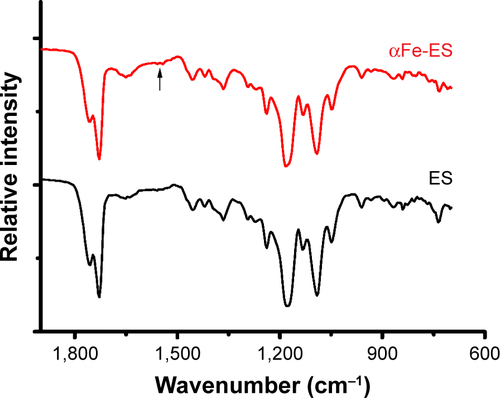
Figure S1 Samples were prepared for attenuated total reflectance Fourier transform infrared spectroscopy (ATR-FTIR; NICOLET6700FT-IR, Thermo Scientific, Dallas, TX, USA) analysis.
Note: Compared with the ES control, αFe-ES showed a peak at 1,543 cm−1, representing the typical stretching of -NR2, which was caused by the nitrogen plasma treatment.
Abbreviations: αFe-ES, αFeNPs-assembled electrospun scaffold; ATR-FTIR, attenuated total reflectance Fourier transform infrared spectroscopy; ES, untreated electrospun scaffold.