Figures & data
Table 1 List of the investigated biorelevant conditions
Figure 1 TEM images with corresponding size, aspect ratio and shape distributions, electron diffraction patterns, Characterization of silver nanoparticles stabilized (A) by citrate (AgNP@C) and (B) by green tea extract (AgNP@GT) consisting of TEM images with corresponding size, aspect ratio and shape distributions, electron diffraction patterns, UV-Vis spectra with characteristic surface plasmon resonance peaks, furthermore mean values for the average hydrodynamic diameter and zeta potential of the particles (pH ~7.2).
Abbreviations: AgNP@C, citrate-capped nanosilver; AgNP@GT, green tea extract-stabilized silver nanoparticle; TEM, transmission electron microscopy.
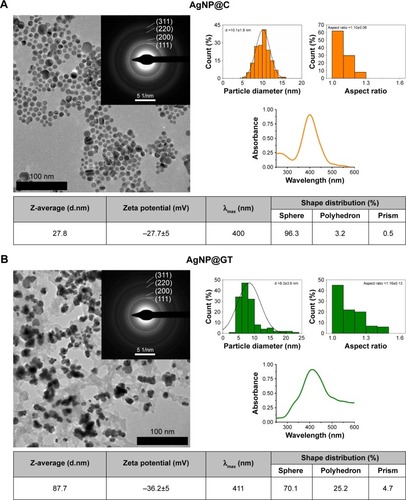
Figure 2 The effect of pH on the aggregation behavior of the as-prepared silver nanoparticles with 10 mM NaCl background concentration.
Notes: Average hydrodynamic diameter (Z-average) trend, zeta potential, and UV-Vis spectrum changes of (A) citrate-stabilized AgNP@C, (B) green tea-stabilized AgNP@ GT, observed over 24 hours. * marks a UV-Vis detection error during the measurements that should be disregarded.
Abbreviations: AgNP@C, citrate-capped nanosilver; AgNP@GT, green tea extract-stabilized silver nanoparticle.
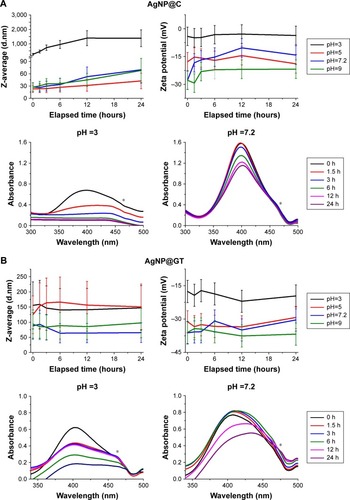
Figure 3 The effect of sodium chloride on the aggregation behavior of the as-prepared silver nanoparticles at pH ~7.2.
Notes: Average hydrodynamic diameter (Z-average) trend, zeta potential, and UV-Vis spectrum changes of (A) citrate-stabilized AgNP@C, (B) green tea-stabilized AgNP@ GT, observed over 24 hours. * marks a UV-Vis detection error during the measurements that should be disregarded.
Abbreviations: AgNP@C, citrate-capped nanosilver; AgNP@GT, green tea extract-stabilized silver nanoparticle.
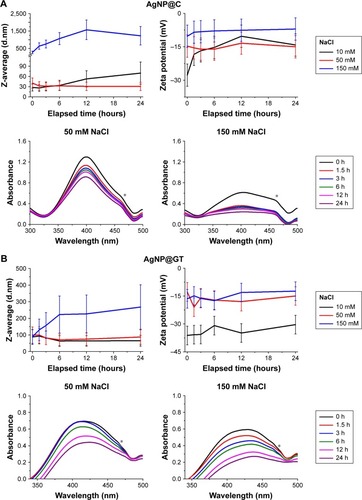
Figure 4 The effect of cell culture medium components DMEM and FBS on the aggregation behavior of the as-prepared silver nanoparticles.
Notes: Average hydrodynamic diameter (Z-average) trend, zeta potential, and UV-Vis spectrum changes of (A) citrate-stabilized AgNP@C, (B) green tea-stabilized AgNP@ GT, observed over 24 hours. * marks a UV-Vis detection error during the measurements that should be disregarded.
Abbreviations: AgNP@C, citrate-capped nanosilver; AgNP@GT, green tea extract-stabilized silver nanoparticle.

Figure 5 The effect of nanoparticle aggregation (citrate-stabilized: AgNP@C, green tea-stabilized: AgNP@GT) on cytotoxicity toward A549 human lung cancer and MRC-5 human fibroblast cells.
Note: Increasing aggregation grades were prepared using 150 mM NaCl for longer time intervals up to 24 hours.
Abbreviations: AgNP@C, citrate-capped nanosilver; AgNP@GT, green tea extract-stabilized silver nanoparticle.
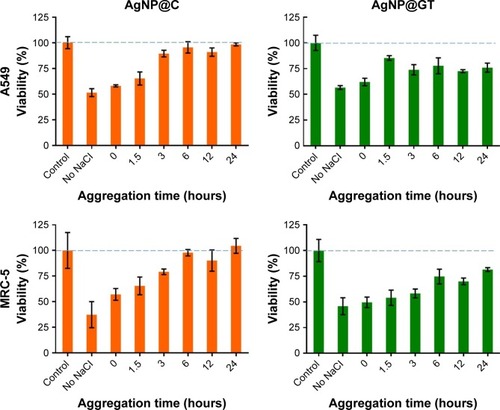
Figure 6 The effect of nanoparticle aggregation (citrate-stabilized: AgNP@C, green tea-stabilized: AgNP@GT) on the antimicrobial activity against C. neoformans, B. megaterium, and E. coli.
Note: Increasing aggregation grades were prepared using 150 mM NaCl for longer time intervals up to 24 hours.
Abbreviations: AgNP@C, citrate-capped nanosilver; AgNP@GT, green tea extract-stabilized silver nanoparticle.
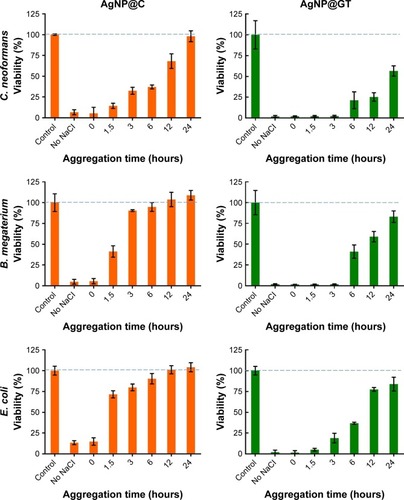
Figure S1 Left: Raman spectra of the prepared silver nanoparticle samples (citrate-stabilized AgNP@C, green tea-stabilized AgNP@GT), green tea extract (GT) and citrate stabilized silver nanoparticles mixed with green tea (AgNP@C + GT). Right: Baselined comparison of the Raman spectra of AgNP@GT and AgNP@C + GT.
Abbreviations: AgNP@C, citrate-capped nanosilver; AgNP@GT, green tea extract-stabilized silver nanoparticle.
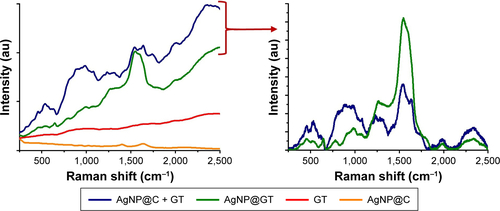
Figure S2 UV-Vis spectral changes of the as-prepared silver nanoparticles (citrate-stabilized AgNP@C, green tea-stabilized AgNP@GT) on pH =5 and pH =9 with 10 mM NaCl background concentration. * marks a UV-Vis detection error during the measurements that should be disregarded.
Abbreviations: AgNP@C, citrate-capped nanosilver; AgNP@GT, green tea extract-stabilized silver nanoparticle.
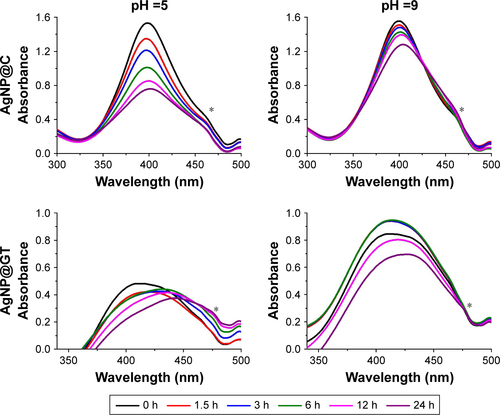
Figure S3 The effect of glucose on the aggregation behavior of the as-prepared silver nanoparticles with 10 mM NaCl background concentration on pH ~7.2. Average hydrodynamic diameter (Z-average) trend, zeta potential, and UV-Vis spectrum changes of (A) citrate-stabilized AgNP@C, (B) green tea-stabilized AgNP@GT, observed over 24 hours. * marks a UV-Vis detection error during the measurements that should be disregarded.
Abbreviations: AgNP@C, citrate-capped nanosilver; AgNP@GT, green tea extract-stabilized silver nanoparticle.
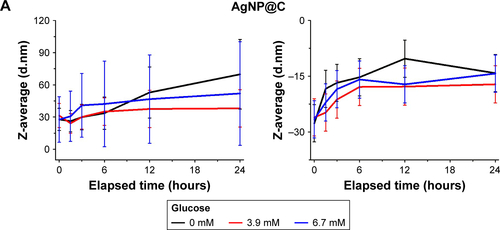
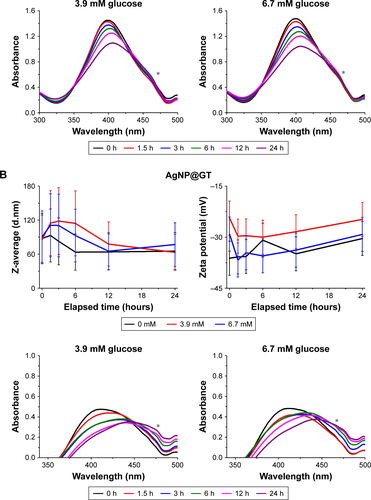
Figure S4 The effect of glutamine on the aggregation behavior of the as-prepared silver nanoparticles with 10 mM NaCl background concentration on pH ~7.2. Average hydrodynamic diameter (Z-average) trend, zeta potential, and UV-Vis spectrum changes of (A) citrate-stabilized AgNP@C, (B) green tea-stabilized AgNP@GT, observed over 24 hours. * marks a UV-Vis detection error during the measurements that should be disregarded.
Abbreviations: AgNP@C, citrate-capped nanosilver; AgNP@GT, green tea extract-stabilized silver nanoparticle.
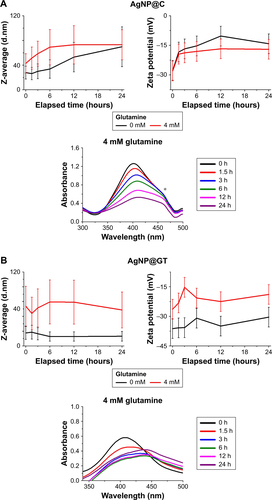
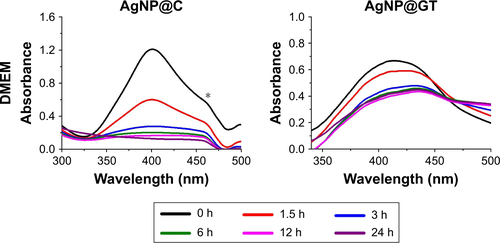
Figure S5 UV-Vis spectral changes of the as-prepared silver nanoparticles (citrate-stabilized AgNP@C, green tea-stabilized AgNP@GT) in the presence of DMEM. * marks a UV-Vis detection error during the measurements that should be disregarded.
Abbreviations: AgNP@C, citrate-capped nanosilver; AgNP@GT, green tea extract-stabilized silver nanoparticle.