Figures & data
Figure 1 Characterization of DATS-MIONs.
Notes: (A) TEM imaging of a single nanoparticle. The scale bar is shown in the lower left corner. (B) Size distribution of DATS-MIONs. (C) Drug loading experiment. One gram of MIONs was used, and the weight of the loaded nanoparticles is shown. (D) Time course of H2S release by DATS-MIONs at different nanoparticle concentrations measured on an H2S-selective microelectrode. (E) Proliferation of HUVECs incubated with different concentrations of DATS-MIONs as monitored on a real-time cell analyzer.
Abbreviations: DATS, diallyl trisulfide; HUVECs, human umbilical vein endothelial cells; MIONs, mesoporous iron oxide nanoparticles; TEM, transmission electron microscopy.
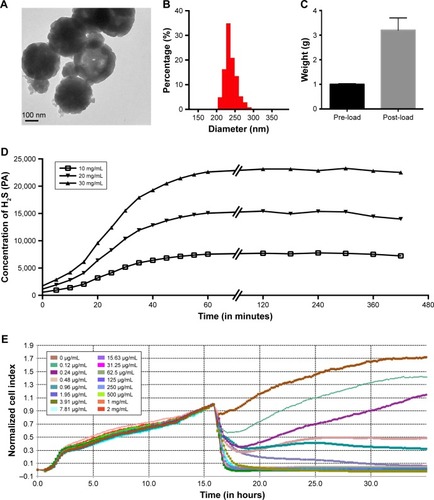
Figure 2 Distribution and biodegradation of DATS-MIONs.
Notes: (A) Biodistribution of DATS-MIONs in mice as visualized by bioluminescence imaging. (B) Biodistribution of DATS-MIONs in Clophosome-treated mice as visualized by bioluminescence imaging. (C) Time course assessment of DATS-MION degradation in untreated (green) and Clophosome-treated (orange) mice. (D) The degradative process of DATS-MIONs induced by Kupffer cells in vitro.
Abbreviations: DATS, diallyl trisulfide; MIONs, mesoporous iron oxide nanoparticles.
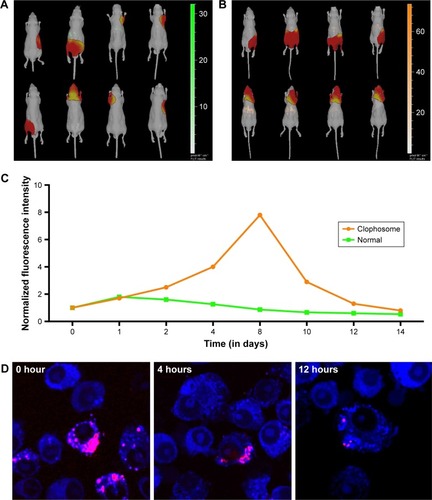
Figure 3 Routine blood test results.
Note: Blood samples were collected from the mice before the injection of DATS-MIONs (control) and on day 2 as well as day 13 after the injection.
Abbreviations: AKP/ALP, alkaline phosphatase; ALT, alanine aminotransferase; AST, aspartate aminotransferase; BUN, blood urea nitrogen; CREA, creatinine; DATS, diallyl trisulfide; HCT, hematocrit; HGB, hemoglobin; LYM, lymphocyte; MCH, mean corpuscular hemoglobin; MCHC, mean corpuscular hemoglobin concentration; MCV, mean corpuscular volume; MIONs, mesoporous iron oxide nanoparticles; RBC, red blood cell; RDW-SD, red blood cell distribution width-standard deviation; WBC, white blood cell.
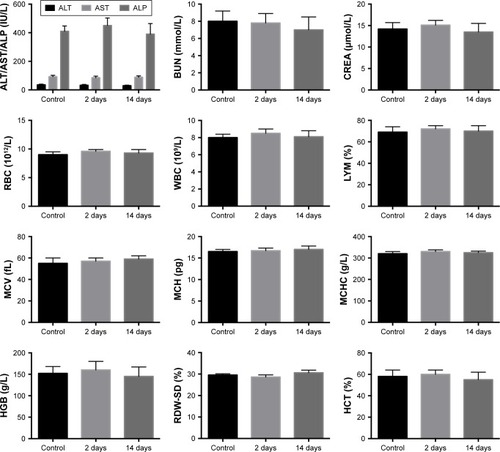
Figure 4 Toxicity assessment of DATS-MIONs via H&E staining in vital organs.
Note: Evaluation in (A) liver, (B) spleen, and (C) kidneys.
Abbreviations: DATS, diallyl trisulfide; MIONs, mesoporous iron oxide nanoparticles.
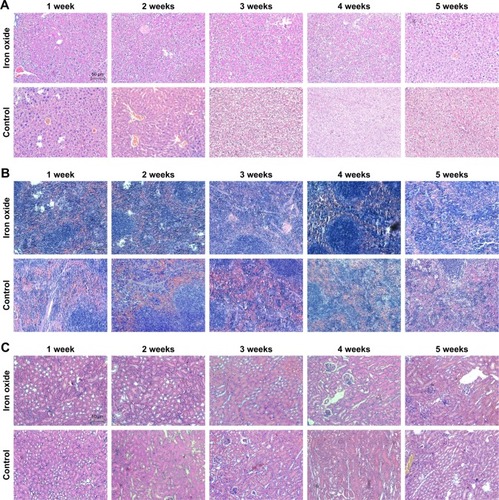
Figure 5 Evaluation of the effect of DATS-MIONs on myocardial protection.
Notes: (A) Proliferation of embryonic cardiomyocyte H9C2 cells incubated with different concentrations of DATS-MIONs as monitored on a real-time cell analyzer. (B) TUNEL assay of myocardial tissues harvested from treated (iron oxide, top) and untreated (control, bottom) mice with IR-induced heart injury. Apoptotic cells were stained positive in the assay and highlighted by the red fluorescence that they emitted. (C) Representative echocardiograms of a mouse with MI in which DATS-MIONs were injected and a mouse with MI as a control that did not receive any treatment. (D) Column charts comparing the heart rate, ejection fraction, and fraction shortening of the three abovementioned murine models. Bars represent standard error of mean. *P<0.05.
Abbreviations: DATS, diallyl trisulfide; IR, ischemia–reperfusion; MI, myocardial infarction; MIONs, mesoporous iron oxide nanoparticles.
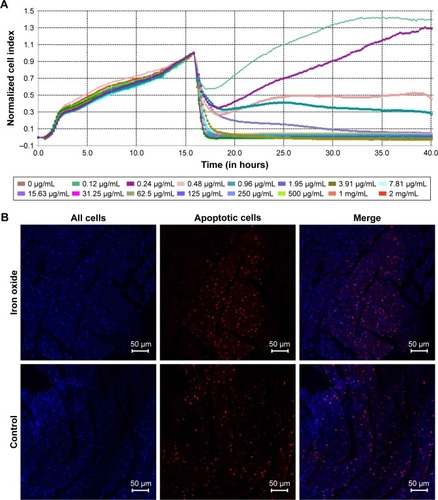
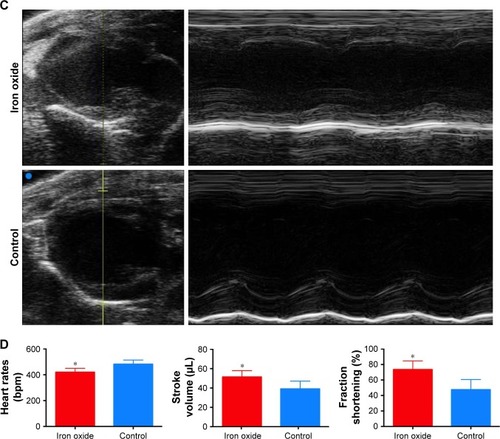
Figure S1 The scheme of microstructure of DATS-MIONs and the process of releasing hydrogen sulfide.
Abbreviations: DATS, diallyl trisulfide; GSH, glutathione; H2S, Hydrogen Sulfide; MIONs, mesoporous iron oxide nanoparticles.
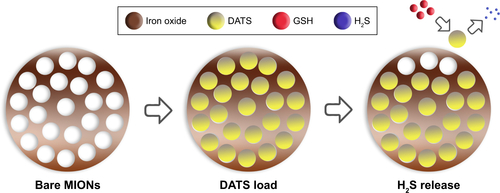
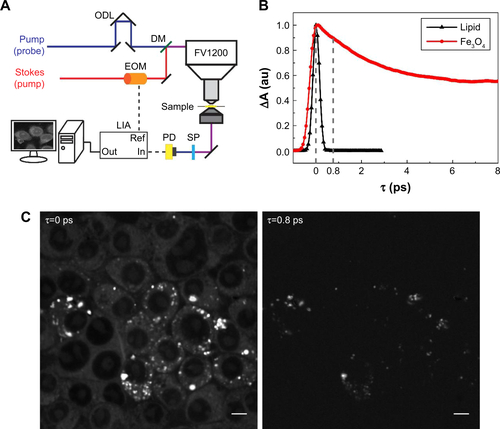
Figure S2 (A) Illustration of dual-modal SRS/TA microscopy. (B) Time-resolved TA dynamics of Fe3O4 nanoparticles and femtosecond SRS curves of oleic acid. (C) SRS images of Kupffer cells and TA images of intracellular Fe3O4 detected at the two time delays (τ) marked in (B). Scale bar: 5 µm.
Abbreviations: ODL, optical delay line; DM, dichroic mirror; EOM, electro-optical modulator; SP, shortpass filter; PD, photodiode; LIA, lock-in amplifier; SRS, stimulated Raman scattering; TA, transient absorption.