
Figures & data
Figure 1 (A) Schematic diagram of the SERS analysis of blood plasma. (B) The mechanism of SERS based on Au-NPs. (C) TEM image of Au-NPs.
Note: The scale bars indicate 50 nm.
Abbreviations: AU-NPs, gold nanoparticles; CCD, charge coupled device; SERS, surface-enhanced Raman spectroscopy; TEM, transmission electron microscopy.
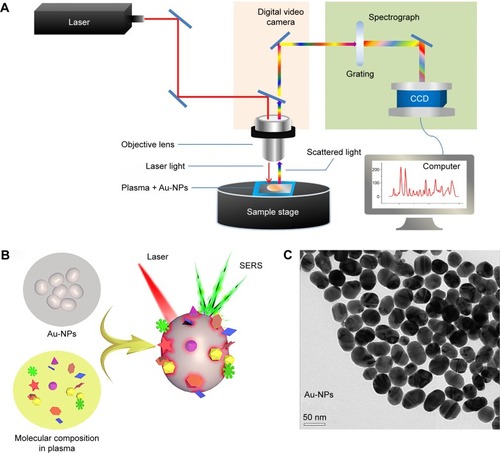
Table 1 Tentative assignments of significant SERS peaks observed in plasmaCitation17,Citation19–Citation23
Figure 2 (A) Comparison of the normalized mean SERS spectra from 38 early biochemical recurrence and 64 bRFS plasma samples. (B) Box plots of the four significant SERS peak intensities (725, 1,014, 1,328, and 1,447 cm−1) for the two groups.
Notes: The line within each box represents the median, while the lower and upper boundaries of the box indicate first and third quartiles, respectively. Comparison of the spectra data via Mann–Whitney U test, **P<0.01.
Abbreviations: BCR, biochemical recurrence; bRFS, biochemical recurrence free survival; SERS, surface-enhanced Raman spectroscopy.
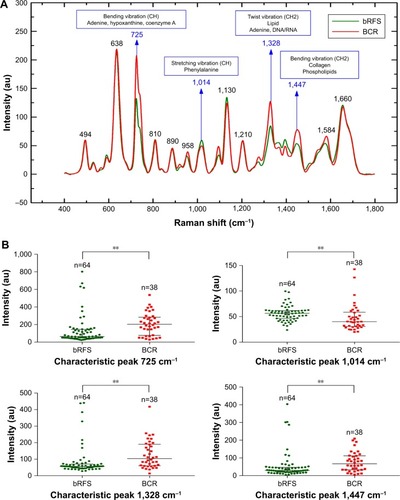
Table 2 Univariate and multivariate Cox proportional hazard analyses of Raman peaks and CAPRA-S
Figure 3 Kaplan–Meier curve showing association of Raman peak 1,328 cm−1 and risk of early biochemical recurrence.
Abbreviation: BCR, biochemical recurrence.
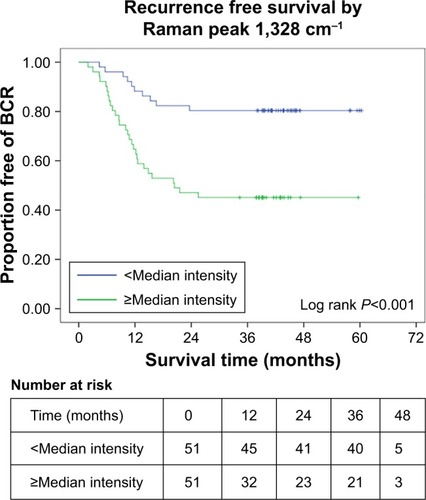
Figure 4 PCA and scatter plots of LDA score of biochemical recurrence and bRFS plasma SERS spectra.
Abbreviations: BCR, biochemical recurrence; bRFS, biochemical recurrence free survival; LDA, linear discrimi nant analysis; PCA, principal component analysis; SERS, surface-enhanced Raman spectroscopy.
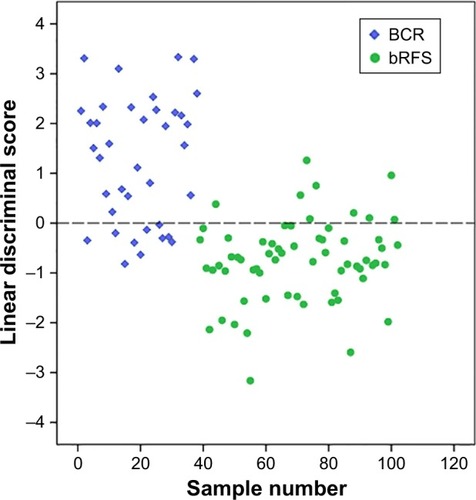
Figure 5 Comparison of ROC curves of PCA-LDA model, Raman peak 1,328 cm−1 combined with CAPRA-S score, CAPRA-S score alone, and Raman peak 1,328 cm−1 alone.
Abbreviations: CAPRA-S, Cancer of the Prostate Risk Assessment postsurgical score; PCA-LDA, principal component analysis and linear discriminate analysis; ROC, receiver operating characteristic.
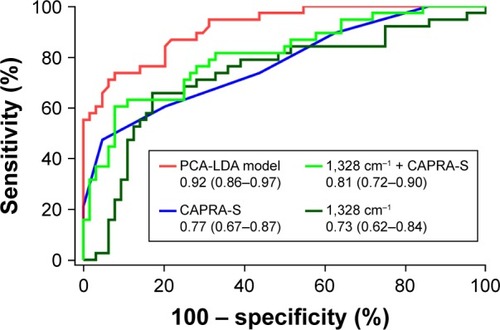
Table S1 Clinical and pathologic information of the study subjects