Figures & data
Figure 1 Illustration of the use of L-DOX in combination with LAA RFCA to reduce the recovery of electrical conduction.
Abbreviations: L-DOX, liposomal doxorubicin; LAA, left atrial appendage; RFCA, radiofrequency catheter ablation.
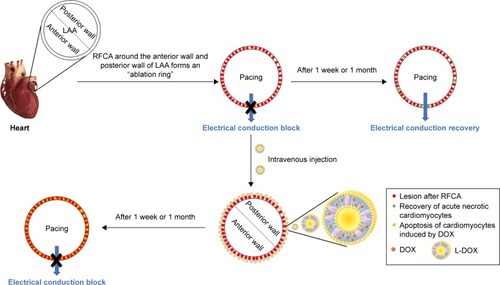
Figure 2 Fluorescence imaging and semi-quantitative data from rabbits following group-appropriate treatments.
Notes: Fluorescence imaging (A) and semi-quantitative data (B). Group A, blank; Group B, SO+L-IR-775; Group C, RFCA+IR-775; Group D, RFCA+L-IR-775. All rabbits were sacrificed 48 hours after intravenous drug administration. Fluorescence imaging (C) and semi-quantitative data (D) from tissues of rabbits in Group D. The white arrow indicates the LAA ablation site. ***P<0.001 versus SO+L-IR-775 treatment; ##P<0.01 vs RFCA+IR-775 treatment. Data are presented as means ± SD.
Abbreviations: LAA, left atrial appendage; L-IR-775, IR-775 liposome; RFCA, radiofrequency catheter ablation; SO, sham-operated.
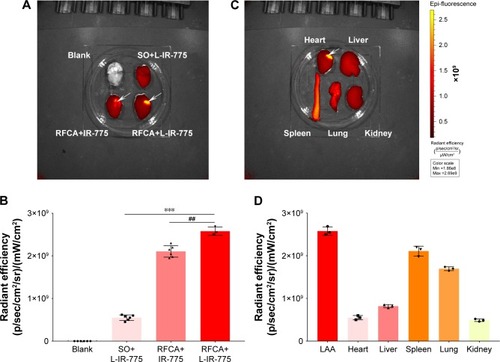
Figure 3 The representative electrophysiological recordings of two groups in four different phases.
Notes: Group A, RFCA (A); Group C, RFCA+L-DOX (B). The dotted line indicates the start of pacing stimulation. n=10 per group.
Abbreviations: L-DOX, liposomal doxorubicin; RFCA, radiofrequency catheter ablation.
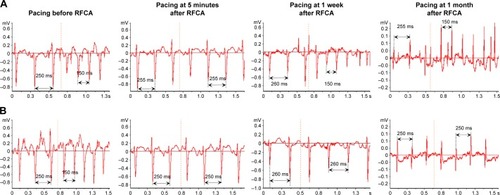
Figure 4 Plots of bio-distribution.
Notes: (A) Plots of DOX bio-distribution in rabbits receiving RFCA+L-DOX. The rabbits were sacrificed on different days after intravenous drug administration, as indicated. (B) Plots of DOX bio-distribution in rabbits in the RFCA+DOX group and RFCA+L-DOX group on the second day after intravenous drug administration. “Heart” refers to the other parts of the heart aside from the LAA. #P<0.05, ###P<0.001 vs 1 day after intravenous administration. *P<0.05, **P<0.01, ***P<0.001 vs free DOX treatment. n=5 per group, data are presented as means ± SD.
Abbreviations: DOX, doxorubicin; L-DOX, liposomal doxorubicin; LAA, left atrial appendage; RFCA, radiofrequency catheter ablation.
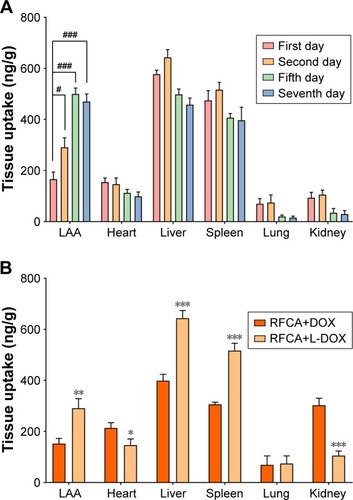
Figure 5 Expression level of apoptosis markers.
Notes: (A) Western blotting results for markers of apoptosis in different groups. Quantitative measurements of the band intensities of Bcl-2 (B), Bax (C), and cleaved CASP3 (D) are shown, following normalization to β-actin. *P<0.05, ***P<0.001 vs SO treatment; ##P<0.01, ###P<0.001 vs RFCA treatment. n=5 per group, data are presented as means ± SD.
Abbreviations: L-DOX, liposomal doxorubicin; NS, not significant; RFCA, radiofrequency catheter ablation; SO, sham-operated.
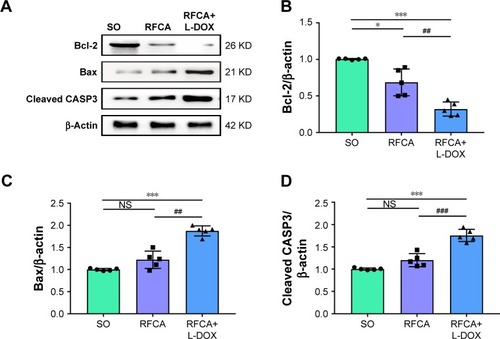
Figure 6 The expression of Bcl-2, Bax, and cleaved CASP3 in different groups (10×40).
Notes: (A) Representative Bcl-2, Bax, and cleaved CASP3 protein levels in different treatment groups were measured via immunohistochemistry analysis. (B–D) Bcl-2, Bax, and cleaved CASP3 protein expression in each group. ***P<0.001 vs SO treatment; ###P<0.001 vs RFCA treatment. n=5 per group, data are presented as means ± SD.
Abbreviations: L-DOX, liposomal doxorubicin; NS, not significant; RFCA, radiofrequency catheter ablation; SO, sham-operated.
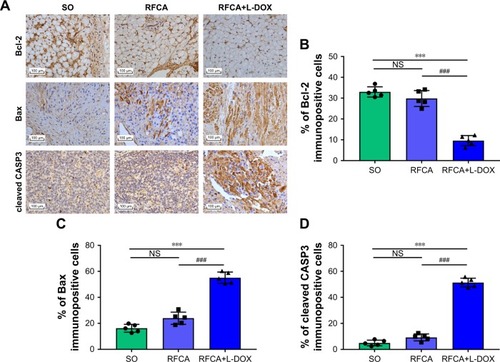
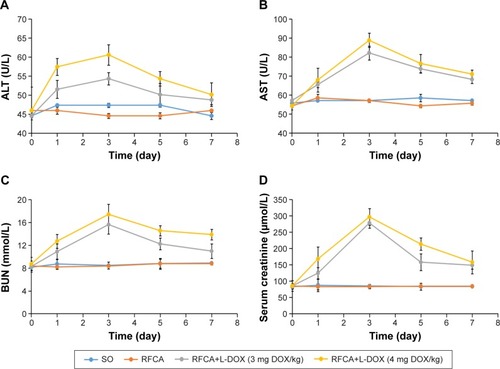
Figure 7 Liver and kidney function markers in the serum of different treatment groups.
Notes: Levels of ALT (A), AST (B), BUN (C), and serum creatinine (D) in each treatment group. n=5 per group, data are presented as means ± SD.
Abbreviations: BUN, blood urea nitrogen; DOX, doxorubicin; L-DOX, liposomal doxorubicin; RFCA, radiofrequency catheter ablation; SO, sham-operated.