Figures & data
Table S1 Characterization of synthesized nanoparticles: GNP, GNP-HC, and GNP-HCPe
Figure 1 CD146 expression on MPM biopsies.
Notes: Immunohistochemical staining of CD146 in MPM biopsies disclosed a positive reaction in tumoral cells (A) compared to the absence of signal in reactive mesothelium (B). Magnification 20×, scale bar 30 μm.
Abbreviation: MPM, malignant pleural mesothelioma.
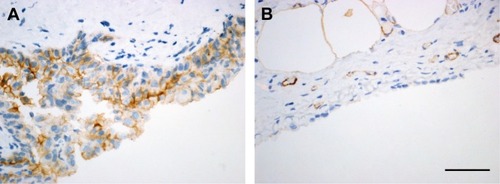
Figure 2 GNP-HC uptake by MSTO-211H and A549 cell lines.
Notes: Internalization of functionalized nanoparticles (green signal) was detected in MSTO-211H (A) but not in A549 (C) cells by confocal microscopy. Inert GNP-PEG, marked with the same fluorochrome, were not captured by MSTO-211H (B) or A549 (D) cells. Nuclei of cells were labeled with DAPI (blue signal). Original magnification: 60×. Scale bar =10 μm.
Abbreviations: GNP, gold nanoparticle; GNP-HC, anti CD146 coated gold nanoparticles.
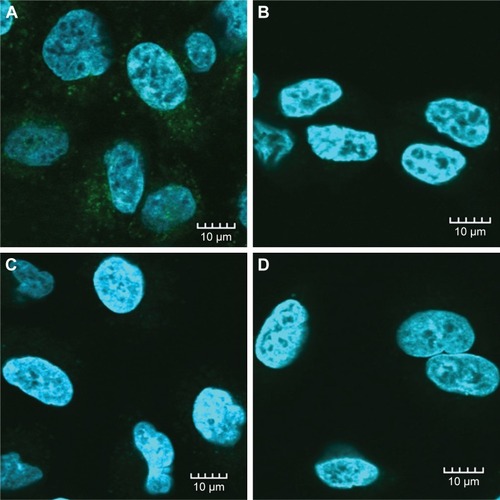
Figure 3 Effect of GNP-HCPe on viability and apoptosis of MPM cell lines.
Notes: Cell viability of MSTO-211H (A) and NCI-H2452 (B) cells was assayed after 24, 48, 72, and 96 hours of treatment with GNP-HCPe and Pe. Apoptosis rate of MSTO-211H (C) and NCI-H2452 (D) cells was assayed at 24 and 48 hours after 2 hours of incubation with GNP-HCPe and Pe. The results are referred to normal viability and apoptotic rate of untreated cells cultured in the same experimental conditions. Histograms are obtained from the mean ± standard error of three experiments. ***P<0.001 vs CTR, Pe; **P<0.01 vs CTR, Pe; *P<0.01 vs CTR; §P<0.05 vs CTR; #P<0.001 vs CTR; and °P<0.01 vs Pe.
Abbreviations: CTR, control; GNP, gold nanoparticle; GNP-HCPe, anti CD146 coated GNPs loaded with Pe; MPM, malignant pleural mesothelioma; Pe, pemetrexed.
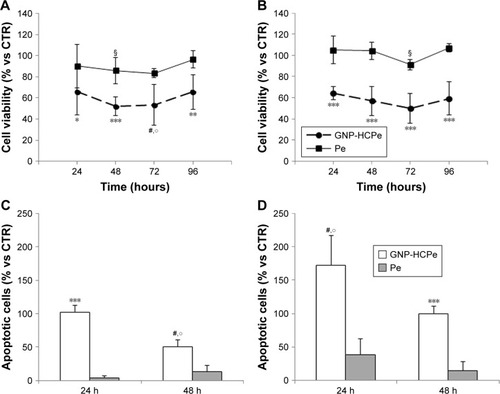
Figure 4 Effect of nanoparticles on cell cycle of MPM cells.
Notes: A and B represent distribution in cycle phases of MSTO-211H and NCI-H2452 cells, respectively, after 24 hours of treatment. C and D represent distribution in cycle phases of MSTO-211H and NCI-H2452 cells, respectively, after 48 hours of treatment. Histograms are obtained from the mean ± standard error of three experiments. ***P<0.001; **P<0.01; and *P<0.05.
Abbreviations: CTR, control; GNP, gold nanoparticle; GNP-HCPe, anti CD146 coated GNPs loaded with Pe; MPM, malignant pleural mesothelioma; Pe, pemetrexed.
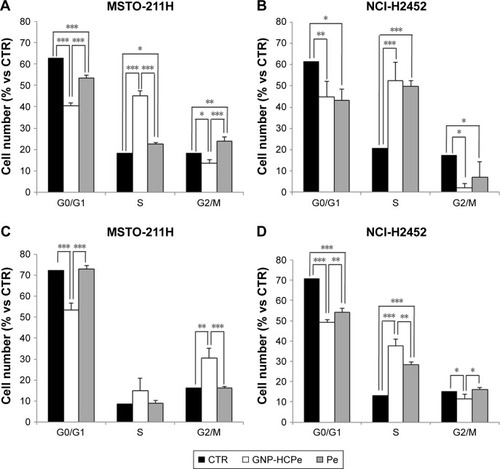
Figure 5 Effect of nanoparticles on ROS level of MPM cells.
Notes: A and B represent ROS production by MSTO-211H and NCI-H2452 cells, respectively, after 48 hours of treatment. Histograms are obtained from the mean ± standard error of three experiments. ***P<0.001 vs CTR; **P<0.01 vs CTR; *P<0.05 vs CTR; ^P<0.05 vs Pe; and #P<0.01 vs Pe.
Abbreviations: CTR, control; GNP, gold nanoparticle; min, minutes; GNP-HCPe, anti CD146 coated GNPs loaded with Pe; MPM, malignant pleural mesothelioma; Pe, pemetrexed.
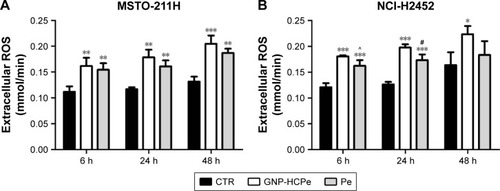
Figure S1 TEM image of unconjugated GNP.
Note: Scale bar =10 μm.
Abbreviations: GNP, gold nanoparticle; TEM, transmission electron microscopy.

Figure S2 Effect of nanoparticles on clonogenic capacity of MPM cells.
Notes: Representative images obtained by soft agar assay of MSTO-211H (A) and NCI-H2452 (B) cells treated with GNP-HCPe and Pe. After 21 days, cells were visualized by MTT test.
Abbreviations: CTR, control; GNP, gold nanoparticle; GNP-HCPe, anti CD146 coated GNPs loaded with Pe; MPM, malignant pleural mesothelioma; Pe, pemetrexed.
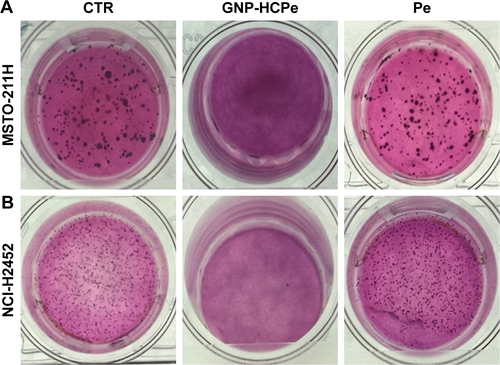
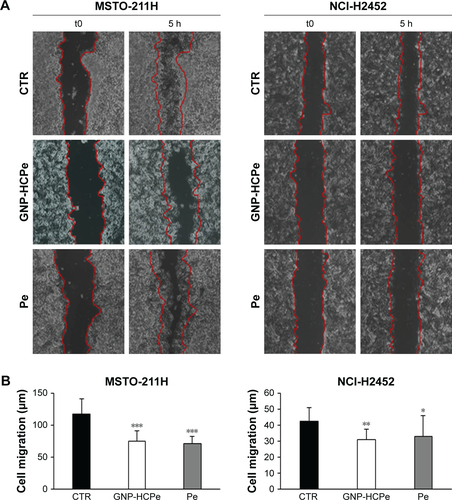
Figure S3 Effect of nanoparticles on migration capacity of MPM cells.
Notes: (A) Representative images of scratch assay of MSTO-211H (left panels) and NCI-H2452 (right panels) cells treated with GNP-HCPe and Pe. Pictures were acquired for 5 hours after wound by live records using a confocal microscopy equipped with a cell culture chamber. (B) Histograms are obtained from the mean ± standard error of three experiments in which ten fields in each plate have been analyzed for cell migration. ***P<0.01 vs CTR; **P<0.01 vs CTR and Pe; and *P<0.05 vs CTR.
Abbreviations: CTR, control; GNP, gold nanoparticle; GNP-HCPe, anti CD146 coated GNPs loaded with Pe; MPM, malignant pleural mesothelioma; Pe, pemetrexed.