Figures & data
Table 1 Nanoparticle size, polydispersity index, and zeta potential of unloaded and gAd-coated nanoparticles. The nanoparticle size (hydrodynamic diameter), polydispersity index, and zeta potential of two different preparations were determined using photon correlation spectroscopy. In this study, unloaded proticles (ON:protamine 1:3), gAd-coated proticles (ON:protamine:gAd 1:3:0.025) as well as plain or gAd-coated liposomes were characterized concerning these parameters. Results express mean values ± standard deviations from six measurements for each preparation
Figure 1 Characterization of gAd-coated nanoparticles. A) Liposomes. A representative transmission electron microscopy image (white bar indicates 100 nm) highlights the size distribution and morphology of liposomes. B) Small angle X-ray scattering of uncoated and gAd-coated liposomes. The intrinsic lipid bilayer parameter (eg, lamellarity and thickness) derived from SAXS curves were not affected by ligand coupling (uncoated liposome [black line], fluorescent-labeled liposome [dotted line] and gAd-coupled liposome [dashed line]). The contribution of dye/protein to the scattering intensity is seen at a low q-range (marked by a frame). The best fit to the data obtained from deconvolution is shown on the right side. The calculated electron density profile, that allows for the determination of the bilayer thickness, estimated as phospholipid head-to-head group distance, d, is shown as an inset on the left side. C) Proticles. Scanning electron microscopy images of freeze-dried adiponectin-coated proticles (mass ratio ON:protamine:adiponectin 1:3:0.025; white bar indicates 250 nm). D) Coating efficiency of adiponectin to proticles. Preassembled proticles were incubated with various amounts of radiolabeled gAd. Calculation of coating efficiency as percentage of deployed adiponectin showed a constant binding amount of gAd to oligonucleotides (analysis of variance, P ⩽ 0.05, n = 3).
Abbreviations: gAd, globular domain of adiponectin; ON, oligonucleotides.
![Figure 1 Characterization of gAd-coated nanoparticles. A) Liposomes. A representative transmission electron microscopy image (white bar indicates 100 nm) highlights the size distribution and morphology of liposomes. B) Small angle X-ray scattering of uncoated and gAd-coated liposomes. The intrinsic lipid bilayer parameter (eg, lamellarity and thickness) derived from SAXS curves were not affected by ligand coupling (uncoated liposome [black line], fluorescent-labeled liposome [dotted line] and gAd-coupled liposome [dashed line]). The contribution of dye/protein to the scattering intensity is seen at a low q-range (marked by a frame). The best fit to the data obtained from deconvolution is shown on the right side. The calculated electron density profile, that allows for the determination of the bilayer thickness, estimated as phospholipid head-to-head group distance, d, is shown as an inset on the left side. C) Proticles. Scanning electron microscopy images of freeze-dried adiponectin-coated proticles (mass ratio ON:protamine:adiponectin 1:3:0.025; white bar indicates 250 nm). D) Coating efficiency of adiponectin to proticles. Preassembled proticles were incubated with various amounts of radiolabeled gAd. Calculation of coating efficiency as percentage of deployed adiponectin showed a constant binding amount of gAd to oligonucleotides (analysis of variance, P ⩽ 0.05, n = 3).Abbreviations: gAd, globular domain of adiponectin; ON, oligonucleotides.](/cms/asset/08387fb4-d495-4877-89ef-5cabea350b37/dijn_a_18739_f0001_b.jpg)
Figure 2 The staining signal of liposomal nanoparticles at atherosclerotic plaques is enhanced by globular adiponectin. Aortic sections of apolipoprotein E-deficient and C57Bl6/J wild type mice were incubated with Atto655-labeled stealth liposomes as controls (B), or with gAd-coupled Atto655-labeled liposomes (C). Blank sections are shown in (A). The upper panels correspond to plaque regions, while the lower panels show the signals in artery sections without plaques. The inserts (B, C) show the weak fluorescence signals from stained wild type aortic tissue. Transmitted light images of the aortic sections are shown in (A) (inserts). The insert between (B) and (C) displays the accumulation of Atto655-labeled gAd at atherosclerotic plaques for comparison. Sections were placed between a glass slide and a cover slip and visualized by confocal laser scanning microscopy (fluorescence and transmitted light). For each visualization, a series of 20–30 fluorescence images in Z (1 μm consecutive intervals) were projected in a single image. Both bars indicate 50 μm.
Abbreviation: gAd, globular domain of adiponectin.
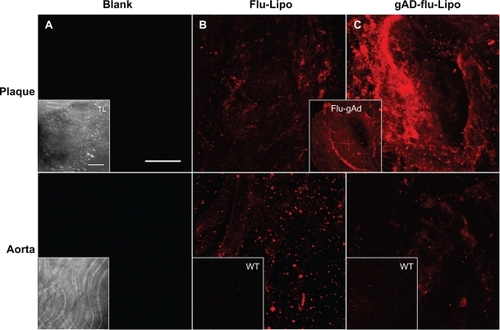
Figure 3 Costaining for anti-CD68. Aortic sections of apolipoprotein E-deficient mice were incubated with Atto655-labeled gAd-coupled stealth liposomes and costained with an Alexa Fluor 488 ready-labeled mouse anti-CD68 antibody. A) Three-dimensional fluorescence images from an atherosclerotic plaque. Bar indicates 50 μm. B) Vertical fluorescence image of the same plaque. Vertical bar indicates 15 μm. The yellow signal in the merged images indicates the colocalization of gAd liposomes (red signal) and anti-CD68 (green signal).
Abbreviation: gAd, globular domain of adiponectin.
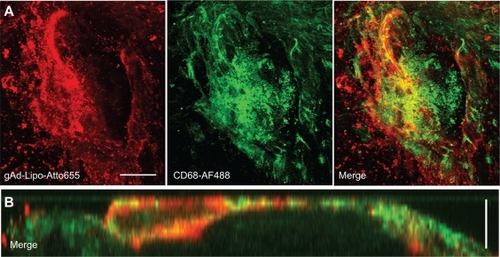
Figure 4 The staining signal of globular adiponectin at atherosclerotic plaques is altered by protamine-oligonucleotide-based nanoparticles. Aortic sections of apolipoprotein E-deficient and C57Bl6/J wild type mice were incubated with Alexa Fluor 488-labeled proticles for control (B), or with gAd-coupled, Alexa Fluor 488-labeled proticles (C). Blank sections are shown in (A). The upper panels correspond to plaque regions, while the lower panels show the signals in artery sections without plaques. The inserts (B, C) show the weak fluorescence signals from stained wild type aortas. Transmitted light images of the aortic sections are shown in (A) (inserts). The inserts in (B) show the accumulation of proticles (green signal) inside a CD68-verified macrophage (M, blue signal). Both bars in (A) indicate 50 μm, bar in the first insert in (B) indicates 5 μm.
Abbreviation: gAd, globular domain of adiponectin.
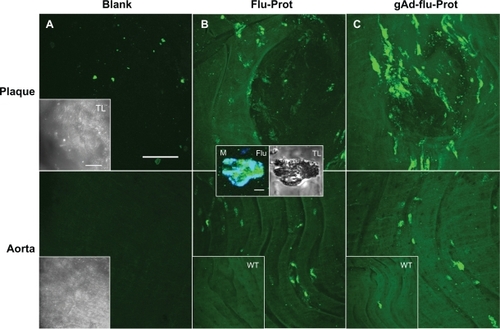
Figure 5 Plaque imaging of gAd-coupled nanoparticles in comparison with uncoupled gAd. Aortic sections of apolipoprotein E-deficient mice were incubated with (A) Atto655-labeled gAd, (B) gAd-coupled Atto655-labeled liposomes, or (C) Atto65-labeled gAd coupled to Alexa Fluor 488-labeled proticles. The pictures show vertical fluorescence and transmitted light images from atherosclerotic plaques similar in size. Nuclei were costained with Hoechst nucleus dye. The yellow signal in the merged image in (C) indicates the colocalization of gAd (red signal) and proticles (green signal). The dashed white lines mark the boundary layer of the plaques. Vertical bar indicates 15 μm.
Abbreviation: gAd, globular domain of adiponectin.
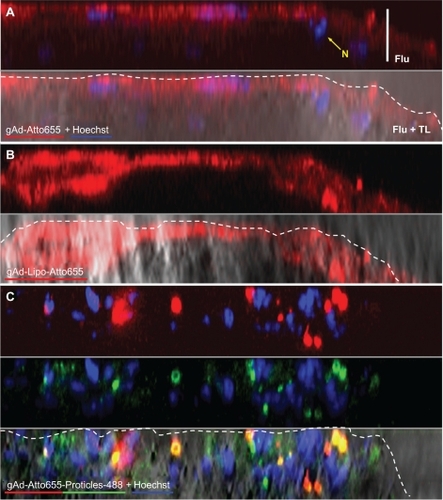
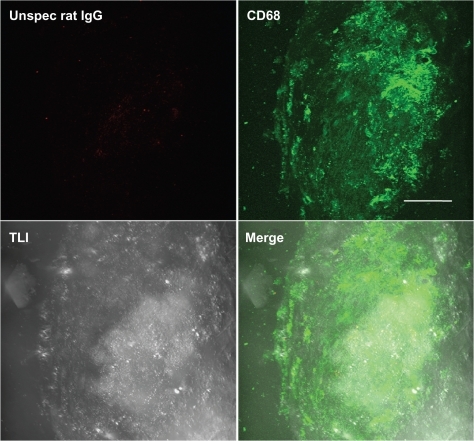
Figure 6 Negative control staining. Three-dimensional fluorescence and transmitted light images from an atherosclerotic plaque. Aortic sections of apolipoprotein E-deficient mice were stained with Atto655-labeled unspecific rat IgG and costained with Alexa Fluor488 ready-labeled mouse anti-CD68. Bar indicates 50 μm.