Figures & data
Figure 1 Schematic diagram of hydrogel composed of hyaluronan and MC for use as a drug delivery platform of KAFAK and BDNF.
Note: Taking advantages of chemical conjunction of thiol maleimide and biotin–streptavidin, MC is chemically modified with KAFAK and BDNF to enable the sustained release of them.
Abbreviations: BDNF, brain-derived neurotrophic factor; KAFAK, KAFAKLAARLYRKALARQLGVAA; MC, methylcellulose.
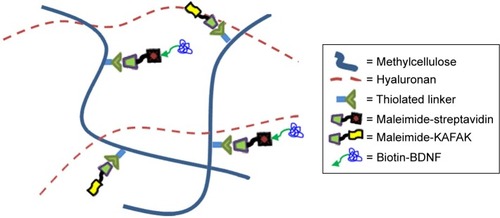
Figure 2 (A) The swelling ratio of HAMC-KAFAK/BDNF hydrogels at the first 24 hours. (B) Effect of BDNF released from HAMC-KAFAK/BDNF hydrogels on the proliferation of PC12 cells at the first 72 hours. (C) KAFAK release pattern of HAMC-KAFAK/BDNF hydrogels in PBS at the first 96 hours. (D) KAFAK release pattern of HAMC-KAFAK/BDNF hydrogels in PBS at the first 96 hours. Data are presented as mean ± SEM, n=3. * in (B) indicates P<0.05, by two-way ANOVA.
Abbreviations: BDNF, brain-derived neurotrophic factor; HAMC, hyaluronan-methylcellulose; KAFAK, KAFAKLAARLYRKALARQLGVAA.
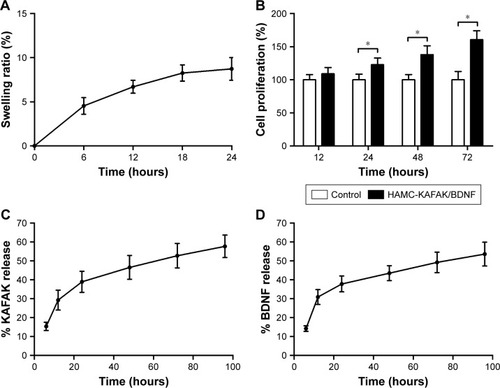
Figure 3 Evaluation of locomotor recovery.
Notes: (A) Changes in the BBB locomotor scores of rats in HAMC-KAFAK/BDNF, HAMC, SCI, and Sham groups at different time points. (B) Inclined plane test performed 4, 6, and 8 weeks after SCI. Data are presented as mean ± SEM, n=12 per group. * indicates P<0.05, respectively, by two-way ANOVA.
Abbreviations: BBB, Basso Beattie Bresnahan; BDNF, brain-derived neurotrophic factor; d, days; HAMC, hyaluronan-methylcellulose; KAFAK, KAFAKLAARLYRKA-LARQLGVAA; SCI, spinal cord injury; w, weeks.
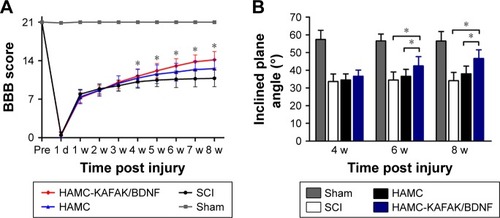
Figure 4 The quality of locomotor recovery was quantified by three parameters of footprint analysis performed at 8 weeks.
Notes: (A) Stride length. (B) Base of support. (C) Rotation angle. (D) Representative footprints. Data are presented as mean ± SEM, n=12 per group. * indicates P<0.05, respectively, by one-way ANOVA.
Abbreviations: BDNF, brain-derived neurotrophic factor; HAMC, hyaluronan-methylcellulose; KAFAK, KAFAKLAARLYRKALARQLGVAA; SCI, spinal cord injury.
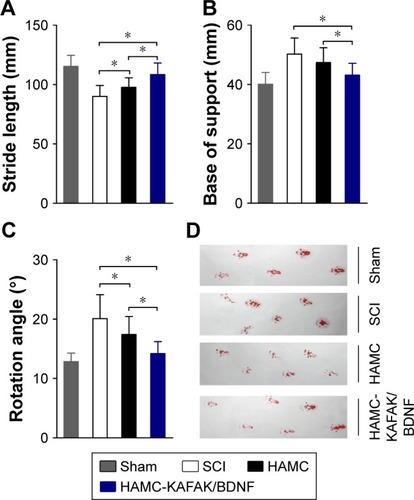
Figure 5 Effects of HAMC-KAFAK/BDNF hydrogel on cytokines expression in the injured spinal cord.
Notes: (A) TNF-α. (B) IL-1β. (C) IL-6. (D) IL-10. Data are presented as mean ± SEM, n=6 per group. * indicates P<0.05, respectively, by one-way ANOVA.
Abbreviations: BDNF, brain-derived neurotrophic factor; HAMC, hyaluronan-methylcellulose; KAFAK, KAFAKLAARLYRKALARQLGVAA; SCI, spinal cord injury; TNF, tumor necrosis factor.
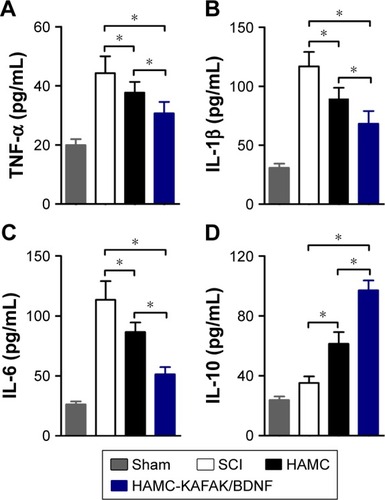
Figure 6 H&E staining and quantitative analysis of cavity volume.
Notes: (A) H&E staining of longitudinal cutting results at 8 weeks after SCI. (B) Quantitative analysis of H&E staining results. Data are presented as mean ± SEM, n=12 per group. * indicates P<0.05, respectively, by one-way ANOVA.
Abbreviations: BDNF, brain-derived neurotrophic factor; HAMC, hyaluronan-methylcellulose; KAFAK, KAFAKLAARLYRKALARQLGVAA; SCI, spinal cord injury.
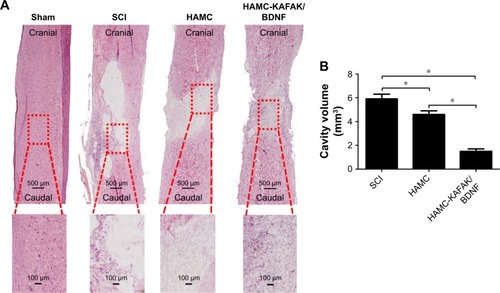
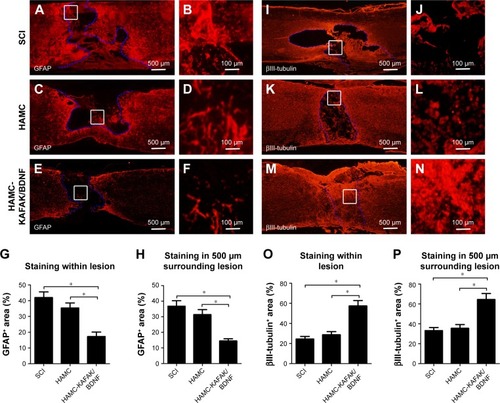
Figure 7 Immunofluorescence staining of GFAP and βIII-tubulin performed 8 weeks after SCI.
Notes: (A–F) Representative images of GFAP expression in rats of SCI, HAMC, and HAMC-KAFAK/BDNF group. (G) Quantitative analysis of the percent of GFAP+ area within the lesion. (H) Quantitative analysis of the percent of GFAP+ area 500 µm surrounding the lesion. (I–N) Representative images of βIII-tubulin expression in rats of SCI, HAMC, and HAMC-KAFAK/BDNF group. (O) Quantitative analysis of the percent of GFAP+ area within the lesion. (P) Quantitative analysis of the percent of GFAP+ area 500 µm surrounding the lesion. Data are presented as mean ± SEM, n=12 per group. * indicates P<0.05, respectively, by one-way ANOVA.
Abbreviations: BDNF, brain-derived neurotrophic factor; GFAP, glial fibrillary acidic protein; HAMC, hyaluronan-methylcellulose; KAFAK, KAFAKLAARLYRKALARQLGVAA; SCI, spinal cord injury.