Figures & data
Figure 1 (A) The size distribution and (B) the TEM graph of CA-LP–DOX/SLB. (C) Release of SLB and DOX from CA-LP–DOX/SLB in PBS solution (pH 7.4) containing SDS (3%, w/v) or PBS solution (pH 2.0) containing SDS (3%, w/v; n=3). (D) The variation of EE% before and after incubation in SGF, SIF, or rat serum for 2, 6, or 12 hours, respectively (n=3). (E) The size distribution before and after incubation in SGF, SIF, or rat serum for 2, 6, or 12 hours, respectively (n=3).
Abbreviations: CA-LP, DSPE-PEG-cholic acid-modified liposomes; DOX, doxorubicin; EE%, encapsulating efficiency; SGF, simulated gastric fluid; SIF, simulated intestinal fluid; SLB, silybin; TEM, transmission electron microscopy.
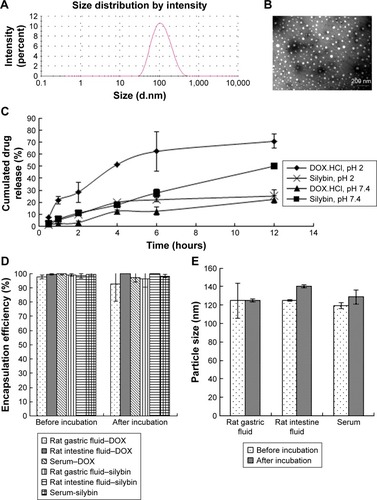
Figure 2 HepG2 cells uptake in vitro by fluorescence microscope images.
Notes: (A) Cellular uptake of free DOX, CA-LP–DOX, or CA-LP–DOX/SLB by HepG2 cells at 37°C (DOX: 4 µg/mL, red = DOX, scale bar =20 µm). (B) Cellular uptake of CA-LP–DOX/SLB at different DOX concentrations at 37°C (red = DOX, scale bar =20 µm). (C) Cellular uptake of CA-LP–DOX/SLB at different incubation temperatures (DOX: 4 µg/mL, red = DOX, scale bar =20 µm).
Abbreviations: CA-LP, DSPE-PEG-cholic acid-modified liposomes; DOX, doxorubicin; SLB, silybin.
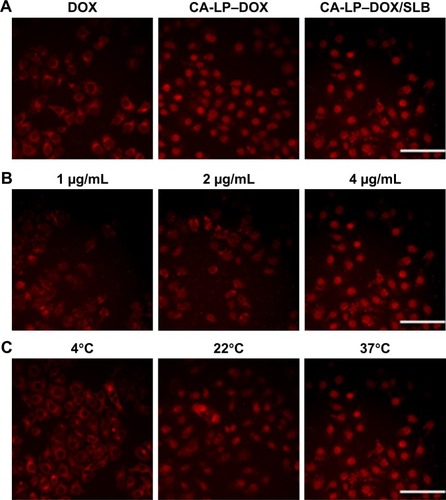
Figure 3 In vitro cytotoxicity.
Notes: Cytotoxicity of DOX, CA-LP–DOX, DOX–SLB, and CA-LP–DOX/SLB (1:3, 1:6, 1:10, and 1:15, respectively) evaluated against H9c2 cells (A) and HepG2 cells (B) after 24 or 48 hours of incubation. (C) Microscope images of HepG2 tumor spheroids after incubation for 7 days with different formulations of treatment. (D) Size change of HepG2 tumor spheroids after incubation for 7 days with different formulations of treatment. Data are presented as mean ± SD of three independent experiments, *P<0.05, compared with blank group.
Abbreviations: CA-LP, DSPE-PEG-cholic acid-modified liposomes; DOX, doxorubicin; SLB, silybin.
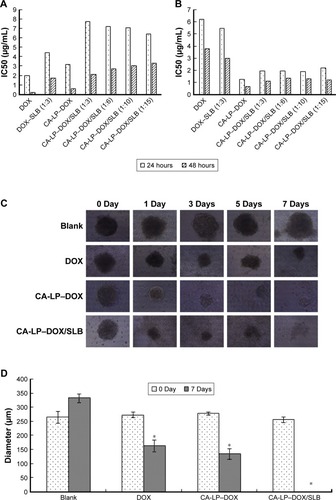
Figure 4 Suppression of cell motility in HCC97H cells.
Notes: *P<0.05, compared with blank group. #P<0.05, compared with CA-LP– DOX/SLB.
Abbreviations: CA-LP, DSPE-PEG-cholic acid-modified liposomes; DOX, doxoru-bicin; SLB, silybin.
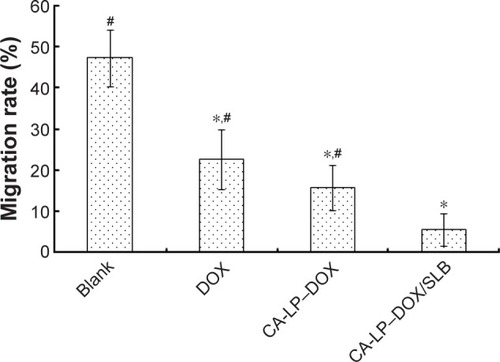
Figure 5 FACS analyses to illustrate apoptosis of (A) HepG2 cells in (a) untreated control, (b) DOX, (c) LP–DOX/SLB, (d) CA-LP–DOX, and (e) CA-LP–DOX/SLB. Both Annexin V Alexa Fluor 488 and PI negative cells are considered undamaged; Annexin V Alexa Fluor 488 positive and PI negative cells are early apoptotic; both Annexin V Alexa Fluor 488 and PI positive cells are late apoptotic; and Annexin V Alexa Fluor 488 negative and PI positive cells are either late apoptotic or necrotic. (B) The cell cycle distribution of untreated and treated cells. The numbers indicate the average fraction of cells in a given phase of the cell cycle as determined from at least three independent experiments (n=3).
Abbreviations: CA-LP, DSPE-PEG-cholic acid-modified liposomes; DOX, doxorubicin; FACS, florescence-activated cell sorting; PI, propidium iodide; SLB, silybin.
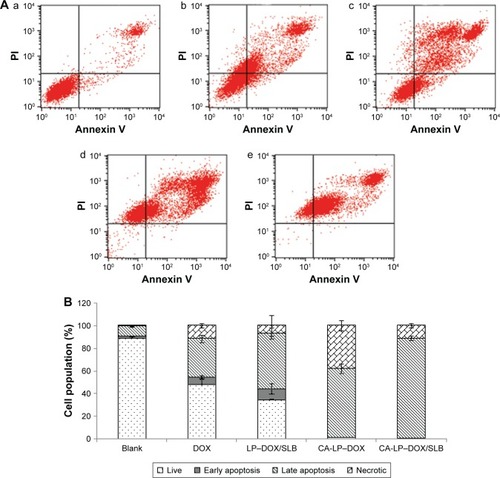
Figure 6 (A) Pharmacokinetic profiles in mice. (B) In vivo distribution in mice (n=5).
Abbreviations: AUC, area under the curve; CA-LP, DSPE-PEG-cholic acid-modified liposomes; DOX, doxorubicin; SLB, silybin.
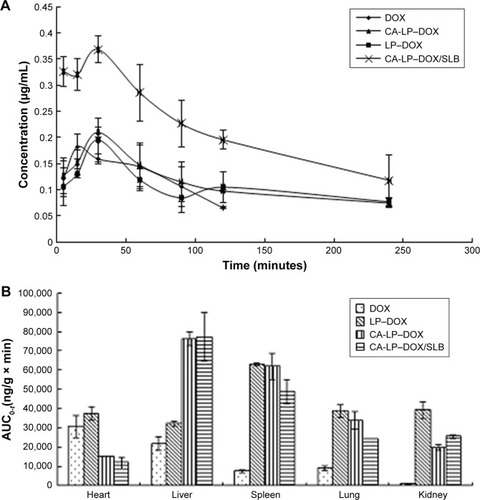
Figure 7 In vivo antitumor effects of different DOX formulations in subcutaneous H22-bearing mice and orthotopic HepG2-bearing nude mice models.
Notes: (A) Relative BW of subcutaneous mice H22 xenografts mice. Data are presented as mean ± SD (n=5). (B) Tumor volume of tumor in subcutaneous mice H22 xenografts models. Data are presented as mean ± SD (n=5). *P<0.05. (C) The representative photograph in subcutaneous mice H22 xenografts models. (D) Photograph of excised liver tumors at the end of the experiment of orthotopic HepG2-bearing nude mice. (E) Excised liver tumor weights of orthotopic HepG2-bearing nude mice. Data are presented as mean ± SD (n=5). *P<0.05. (F) Histological section of liver tissue of orthotopic HepG2-bearing nude mice (magnification ×200).
Abbreviations: BW, body weight; CA-LP, DSPE-PEG-cholic acid-modified liposomes; DOX, doxorubicin; SLB, silybin.
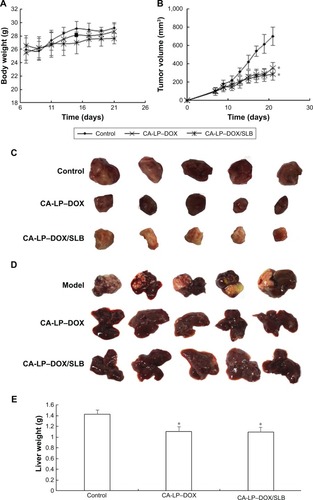
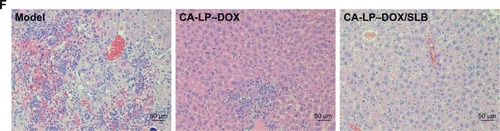
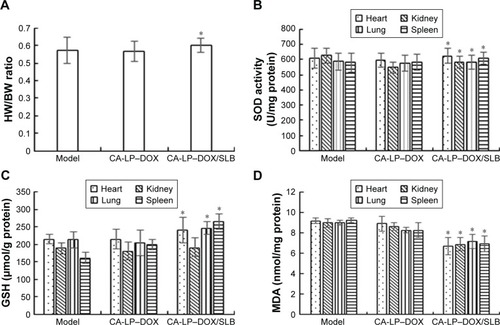
Figure 8 The levels of HW/BW ratio (A), SOD (B), GSH (C), and MDA (D) after oral administration with DOX formulations in HepG2-bearing nude mice (n=5, mean ± SD, *P<0.05, compared with CA-LP–DOX.).
Abbreviations: CA-LP, DSPE-PEG-cholic acid-modified liposomes; DOX, doxorubicin; GSH-Px, glutathione peroxidase; HW/BW, heart weight/body weight; MDA, malonaldehyde; SLB, silybin; SOD, superoxide dismutase.