
Figures & data
Figure 1 Characterization of TOI_HNPs.
Notes: (A) TEM image of TOI_HNPs. (B, C) Optical microscopy images of TOI_HNPs and phase-transited TOI_HNPs after laser irradiation. (D) Optical microscopy image of TOI_HNPs heated at 49°C for 10 seconds. (E, F) Size distribution and zeta potential of TOI_HNPs before (the blue line) and after (the red line) laser irradiation measured by DLS.
Abbreviations: DLS, dynamic light scattering; ICG, indocyanine green; PFP, perfluoropentane; LPHNPs, lipid–polymer hybrid nanoparticles; TEM, transmission electron microscope; TOI_HNPs, folate-targeted LPHNPs-loaded ICG/PFP-carrying oxygen.
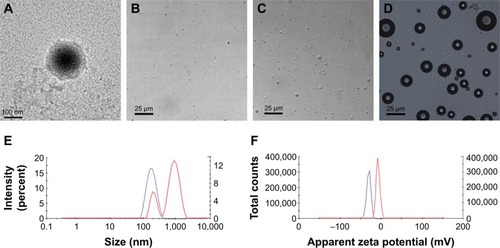
Table 1 Physicochemical property of the fabricated NPs
Figure 2 Comparison of essential properties for developed NPs.
Notes: (A, B) Absorption and fluorescence spectra of free ICG, OI_PNPs, TOI_LNPs, and TOI_HNPs. (C, D) Normalized absorption and fluorescence intensity of free ICG, OI_PNPs, TOI_LNPs, and TOI_HNPs every 3 days. (E) The size stability of OI_PNPs, TOI_LNPs, and TOI_HNPs at different time intervals. (F) The change of the dissolved oxygen concentration levels for prepared solutions before and after laser plus US treatment. (G) Release profile of ICG from OI_PNPs, TOI_LNPs, and TOI_HNPs in PBS and in BSA at 37°C and 100 rpm.
Abbreviations: ICG, indocyanine green; LPHNPs, lipid–polymer hybrid nanoparticles; NPs, nanoparticles; OI_PNPs, PLGA NPs-encapsulated ICG and PFP-carrying oxygen; PFP, perfluoropentane; PLGA, poly (lactic-co-glycolic acid); TOI_HNPs, folate-targeted LPHNPs-loaded ICG/PFP-carrying oxygen; TOI_LNPs, folic-targeted lipid NPs-encapsulated ICG and PFP-carrying oxygen; US, ultrasound; FL, fluorescence.
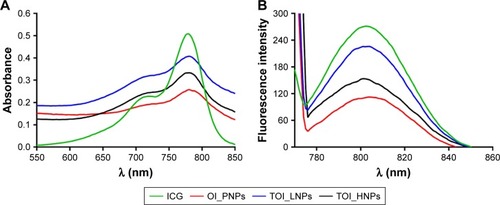
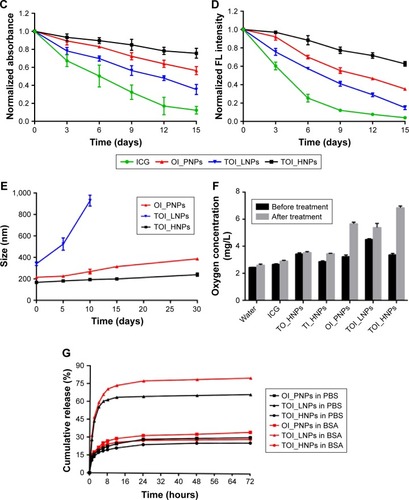
Figure 3 Dual-mode imaging in vitro agar-gel model.
Notes: (A) B mode and CEUS imaging of particles before and after laser irradiation for degassed water, free ICG, TO_HNPs, and TOI_HNPs. (B, C) The semi-quantitative of EI in B mode and CEUS before and after laser irradiation. (D) US mode and PA mode imaging for the same groups before and after laser irradiation. (E, F) The semi-quantitative of EI in US mode and PA average value in PA mode before and after laser irradiation. TOI_HNPs of post-irradiation compared with the pre-irradiation, *P<0.05; after laser irradiation, TOI_HNPs compared with the other groups at the same conditions, #P<0.05.
Abbreviations: CEUS, contrast-enhanced ultrasound; EI, echo intensity; ICG, indocyanine green; LPHNPs, lipid–polymer hybrid nanoparticles; PFP, perfluoropentane; TOI_HNPs, folate-targeted LPHNPs-loaded ICG/PFP-carrying oxygen; US, ultrasound; TO_HNPs, folate-targeted LPHNPs-loaded PFP-carrying oxygen.

Figure 4 Cellular uptake of nanoparticles by SKOV3 cells (FR positive) and A549 cells (FR negative).
Notes: (A) Fluorescence confocal microscopy images of SKOV3 cells incubated with TOI_HNPs, OI_PNPs, and TOI_HNPs plus free FA for 1 hour. A549 cells incubated with TOI_HNPs and OI_PNPs for 1 hour. Scale bar is 25 µm. (B, C) Flow cytometric analysis of mean fluorescence intensity for SKOV3 cells. (D, E) Flow cytometric analysis of mean fluorescence intensity for A549 cells. Compared with control, *P<0.05; compared with other groups, #P<0.05.
Abbreviations: FA, folic acid; ICG, indocyanine green; LPHNPs, lipid–polymer hybrid nanoparticles; PFP, perfluoropentane; TOI_HNPs, folate-targeted LPHNPs-loaded ICG/PFP-carrying oxygen; OI_PNPs, PLGA NPs-encapsulated ICG and PFP-carrying oxygen; PLGA, poly (lactic-co-glycolic acid); FL, fluorescence.
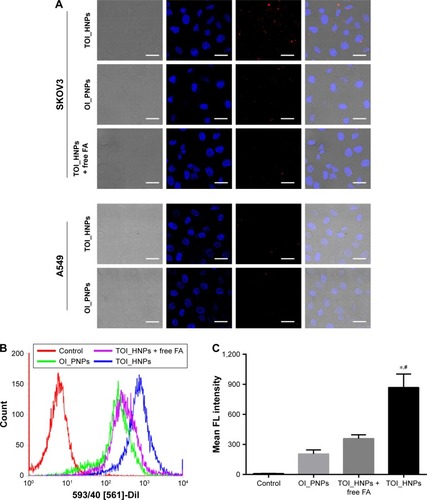
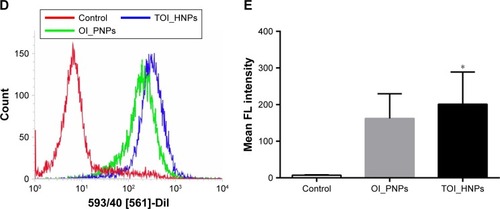
Figure 5 Therapeutic effect in SKOV3 cells after different treatments.
Notes: (A) Cytotoxicity of TOI_HNPs using the MTT assay at a concentration of ICG for 0–128 µg/mL. (B) Cell viability of SKOV3 cells under different treatments was determined by the MTT assay (8 µg/mL of ICG). (C, D) Apoptosis detected by flow cytometry 24 hours after different treatments. Compared with control, *P<0.05; compared with other groups, #P<0.05.
Abbreviations: ICG, indocyanine green; MTT, 3-(4,5-dimethylthiazol-2-yl)-2,5-diphenyltetrazoliumbromide; PFP, perfluoropentane; PSDT, photo–sonodynamic therapy; LPHNPs, lipid–polymer hybrid nanoparticles; TOI_HNPs, folate-targeted LPHNPs-loaded ICG/PFP-carrying oxygen; FITC, fluorescein isothiocyanate.
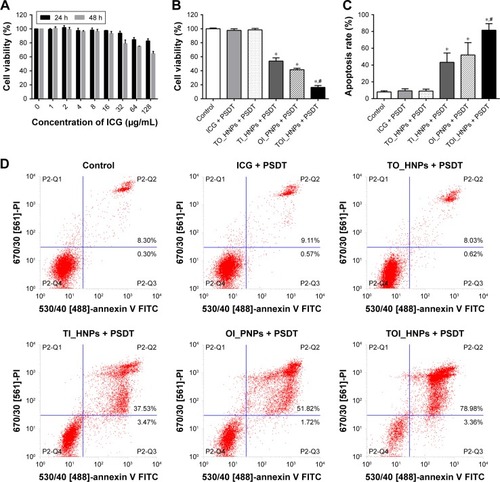
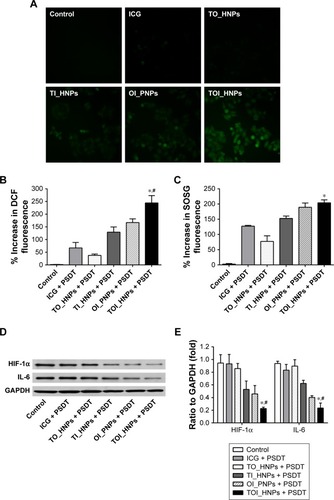
Figure 6 The underlying mechanism of therapy.
Notes: (A) The intracellular ROS production was detected by fluorescence microscopy in SKOV3 cells incubated with DCFH-DA. Scale bar is 50 µm. (B) Percentage increase in DCF fluorescence for ICG, TO_HNPs, TI_HNPs, OI_PNPs, and TOI_HNPs incubated with SKOV3 cells upon exposure to laser and US measured by fluorescence microplate reader. (C) Percentage increase in SOSG fluorescence for ICG, TO_HNPs, TI_HNPs, OI_PNPs, and TOI_HNPs with laser and US exposure. (D, E) HIF-1α and IL-6 protein expression in SKOV3 cells was analyzed by Western blot after different treatments. GAPDH was used as an internal reference. Compared with control, *P<0.05; compared with other groups, #P<0.05.
Abbreviations: DCF, 2′,7′-dichlorofluorescein; DCFH-DA, 2′,7′-dichlorofluorescin diacetate; HIF-1α, hypoxia-inducible factor 1-alpha; ICG, indocyanine green; LPHNPs, lipid–polymer hybrid nanoparticles; PFP, perfluoropentane; OI_PNPs, PLGA NPs-encapsulated ICG and PFP-carrying oxygen; SOSG, Singlet Oxygen Sensor Green; TOI_HNPs, folate-targeted LPHNPs-loaded ICG/PFP-carrying oxygen; US, ultrasound; PLGA, poly (lactic-co-glycolic acid); TO_HNPs, folate-targeted LPHNPs-loaded PFP-carrying oxygen; TI_HNPs, folate-targeted LPHNPs-loaded ICG; GAPDH, glyceraldehyde phosphate dehydrogenase.
Scheme 1 Schematic illustration of the synthesis and structure of TOI_HNPs.
Abbreviations: DPPC, phosphatidylcholine; DPPG, 1,2-dipalmitoyl-sn-glycero-3-phospho-(1′-rac-glycerol) ; DSPE-PEG-FA, 1,2-distearoyl-sn-glycero-3-phosphoethanolamine-N-[folate(polyethyleneglycol)-2000]; ICG, indocyanine green; LPHNPs, lipid–polymer hybrid nanoparticles; PFP, perfluoropentane; PLGA_NPs, poly (lactic-co-glycolic acid) nanoparticles; TOI_HNPs, folate-targeted LPHNPs-loaded ICG/PFP-carrying oxygen.
![Scheme 1 Schematic illustration of the synthesis and structure of TOI_HNPs.Abbreviations: DPPC, phosphatidylcholine; DPPG, 1,2-dipalmitoyl-sn-glycero-3-phospho-(1′-rac-glycerol) ; DSPE-PEG-FA, 1,2-distearoyl-sn-glycero-3-phosphoethanolamine-N-[folate(polyethyleneglycol)-2000]; ICG, indocyanine green; LPHNPs, lipid–polymer hybrid nanoparticles; PFP, perfluoropentane; PLGA_NPs, poly (lactic-co-glycolic acid) nanoparticles; TOI_HNPs, folate-targeted LPHNPs-loaded ICG/PFP-carrying oxygen.](/cms/asset/fb4477a5-631f-41f4-aecf-ba0e99bb9cdd/dijn_a_12190671_f0007_c.jpg)