Figures & data
Figure 1 Design, alignment and biochemical characteristics of the synthetic peptides.
Notes: (A) Alignment of the primary structures of PνD1 and the four synthetic peptides in amino acid one-letter code. Numbers above the PνD1 sequence indicate the peptide size in amino acids. The amino acid residues in blue represent the PνD1 γ-core region. The amino acid residues in red represent the replaced residues in the original PνD1 sequence as follows: C residues were replaced by A, and D residues were replaced by R. Amino acid residues in black are not part of the γ-core region and were not changed. Numbers in the synthetic peptide names stand for the amino acid position in the original PνD1. Double-plus (++) indicates the double replacement from the original D to R amino acid residues to increase the synthetic peptide positive net charge. (B) Biochemical characteristics of the synthetic peptides.

Figure 2 Antifungal effects of γ31-45PνD1 and γ31-45PνD1++ incubated for 24 hours at different concentrations on Candida albicans and Candida buinensis. *Indicates significance by the one-way analysis of variance (ANOVA) (P<0.05).
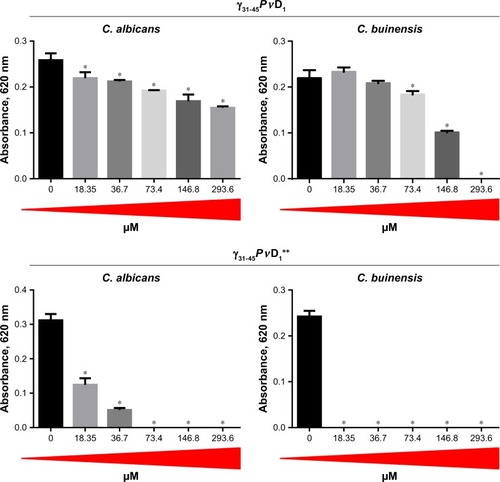
Figure 3 Antifungal effect of γ33-41PνD1 and γ33-41PνD1++ incubated for 24 hours at different concentrations on Candida albicans and Candida buinensis. *Indicates significance by the one-way analysis of variance (ANOVA) (P<0.05).
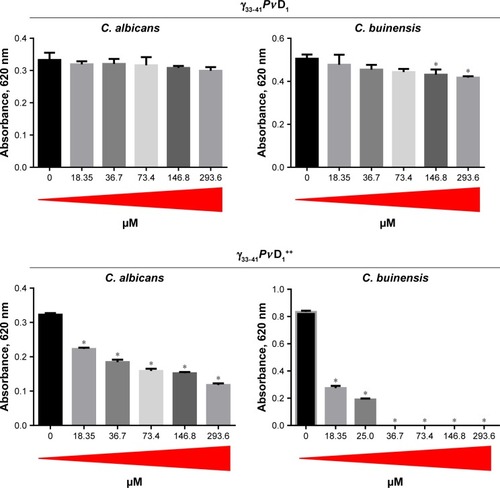
Figure 4 MIC determination and cell viability loss.
Notes: (A) Images of the plate wells at the end of the growth inhibition assay (at 24 hours) showing the growth pattern of Candida buinensis cells at the bottom of the wells in the absence (control) and in the presence of different γ33-41PνD1++ concentrations. (B) Table showing the number of CFU and the percentage of viability loss of C. buinensis cells after treatment with 36.7 and 73.4 µM of γ33-41PνD1++ for 24 hours, respectively. *Indicates significance by the one-way analysis of variance (ANOVA) (P<0.05). (C) Images of Petri dishes showing the CFU as described in (B). The experiments were carried out in triplicate.
Abbreviations: CFU, colony forming units; MIC, minimal inhibitory concentration.
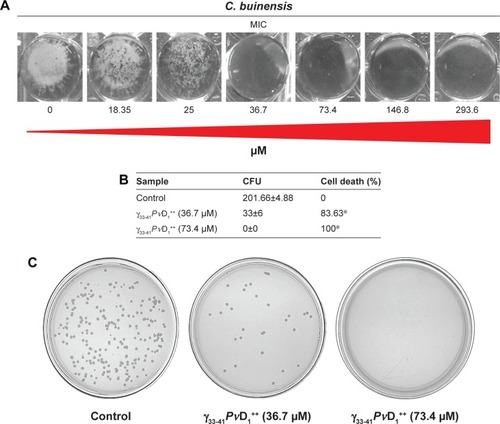
Figure 5 Images of membrane permeabilization assay of Candida buinensis cells after treatment with γ33-41PνD1++ (25 µM) for 24 hours. Control cells were treated only with the Sytox green probe and positive control cells were treated with 300 mM ethanol. Bars =20 µm.
Abbreviation: DIC, differential interference contrast.
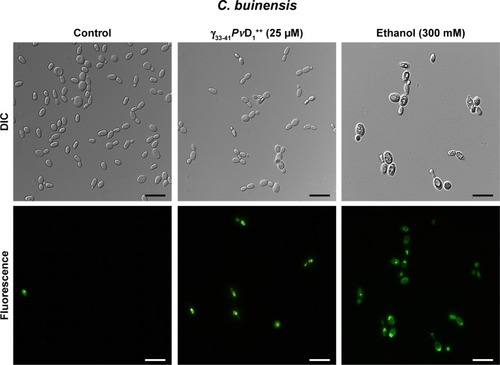
Figure 6 Images of reactive oxygen species assay detection in Candida buinensis cells after treatment with γ33-41PνD1++ (25 µM) for 24 hours. Control cells were treated only with the 2′,7′-dichlorofluoresceindiacetate probe and positive control cells were treated with 300 mM hydrogen peroxide. Bars =20 µm.
Abbreviation: DIC, differential interference contrast.
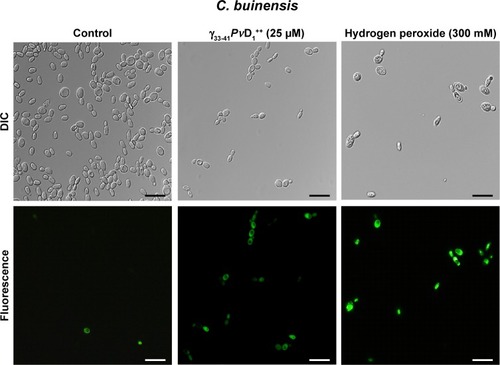
Figure 7 Images of mitochondrial functionality assay of Candida buinensis cells after treatment with γ33-41PνD1++ (25 µM) for 12 and 24 hours. Control cells were treated only with Rhodamine 123 probe and positive control cells were treated with 300 mM ethanol. Bars =20 µm.
Abbreviation: DIC, differential interference contrast.
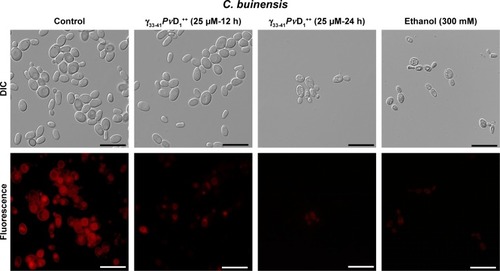
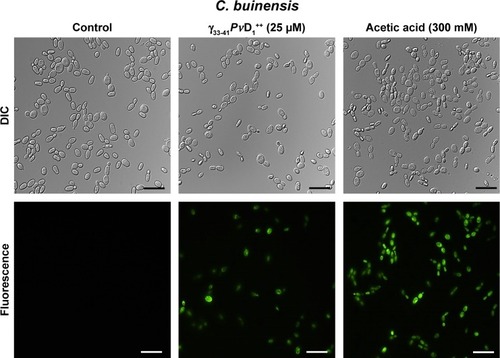
Figure 8 Images of detection of metacaspase activity assay of Candida buinensis cells after treatment with γ33-41PνD1++ (25 µM) for 24 hours. Control cells and cells treated with γ33-41PvD1++ were incubated with CaspACE FITC-VAD-FMK probe. Positive control cells were treated with 300 mM acetic acid and analyzed by fluorescence microscopy. Bars =20 µm.
Abbreviation: DIC, differential interference contrast.