Figures & data
Figure 1 Optical images of GQDs in aqueous solution: (A) under visible light and (B) under UV irradiation.
Abbreviation: GQDs, graphene quantum dots.
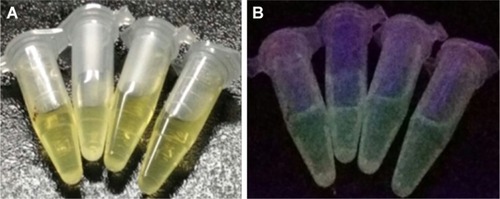
Figure 2 Characterization of biosurfactant, GQDs, biosurfactant-GQDs, and FA-biosurfactant-GQDs conjugates.
Notes: (A) UV–vis absorption spectra. (B) Fluorescence spectra (under different excitation wavelengths ranging from 360 to 370 nm). (C) PL decay curves of GQDs and their conjugates under a UV beam of 365 nm.
Abbreviations: FA, folic acid; GQDs, graphene quantum dots; PL, photoluminescence; UV–vis, ultraviolet–visible.
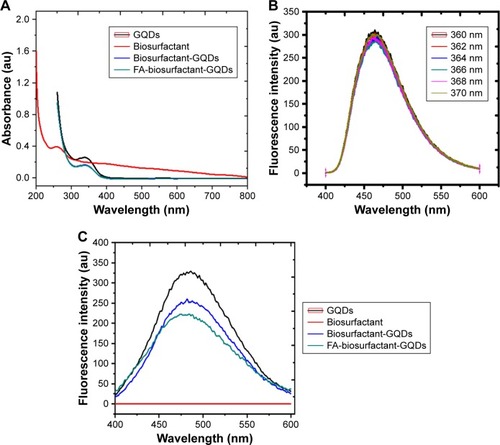
Figure 3 TEM images of (A) clusters of GQDs and (B) size of GQDs (in nm).
Abbreviations: GQDs, graphene quantum dots; TEM, transmission electron microscopy.
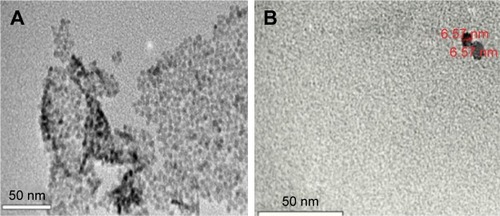
Figure 4 XRD of biosurfactant, GQDs, biosurfactant-GQDs conjugate, and FA-biosurfactant-GQDs conjugate.
Abbreviations: FA, folic acid; GQDs, graphene quantum dots; XRD, X-ray diffraction.
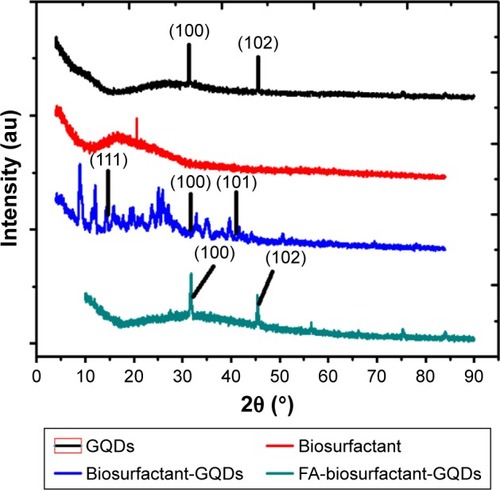
Figure 5 FTIR spectrum of GQDs, biosurfactant-GQDs conjugate, and FA-biosurfactant-GQDs conjugate.
Abbreviations: FA, folic acid; FTIR, Fourier-transform infrared spectroscopy; GQDs, graphene quantum dots.
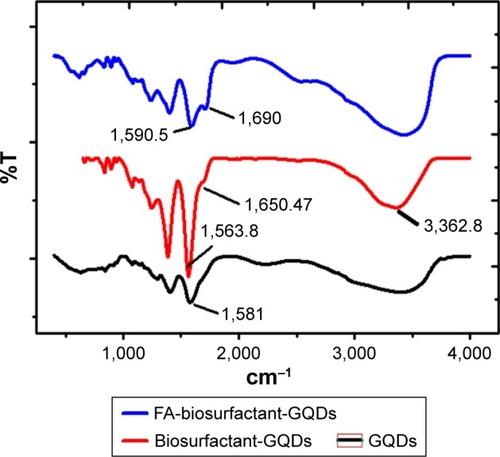
Figure 6 MTT cytotoxicity assay: (A) cytotoxicity of GQDs against MCF-7 cancer cells, (B–D) cytotoxicity of biosurfactant, biosurfactant-GQDs conjugate, and FA-biosurfactant-GQDs conjugate against MCF-7 cancer cells, respectively.
Abbreviations: FA, folic acid; GQDs, graphene quantum dots.
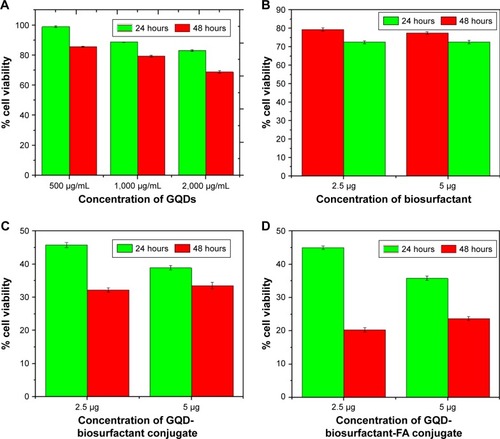
Figure 7 CLSM images of MCF-7 cells (A) under bright field and (B) nucleus stained with DAPI excited by a 405 nm laser.
Abbreviation: CLSM, confocal laser scanning microscopy.
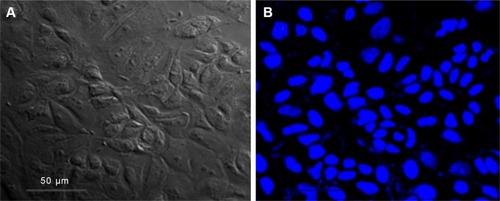
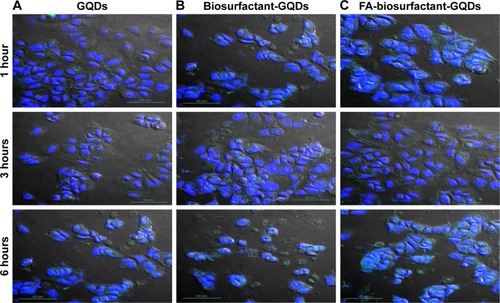
Figure 8 CLSM images of MCF-7 cells treated for 1, 3, and 6 hours with (A) GQDs, (B) biosurfactant-GQDs conjugate, and (C) FA-biosurfactant-GQDs conjugate. Scale for all images is 50 µm.
Abbreviations: CLSM, confocal laser scanning microscopy; FA, folic acid; GQDs, graphene quantum dots.