
Figures & data
Figure 1 Inhibition of cell viability with mEHT plus Lipodox® treatment.
Notes: Cancer cells (A) HepG2, (B) A549, (C) U87MG, (D) CT26 were incubated under three conditions: in a water bath at 37°C as control, in a water bath at 42°C, and with mEHT at 42°C for 30 minutes. Cells for viability assay were cultured for 24 hours after treatment, and viable cell yield was determined by the Trypan Blue exclusion method. Histograms for the percentage of Trypan Blue-negative cells are shown. Data represent mean ± SD (n=3). *P<0.05, **P<0.01, ***P<0.005.
Abbreviations: Lipodox®, liposome-encapsulated doxorubicin; mEHT, modulated electro-hyperthermia.
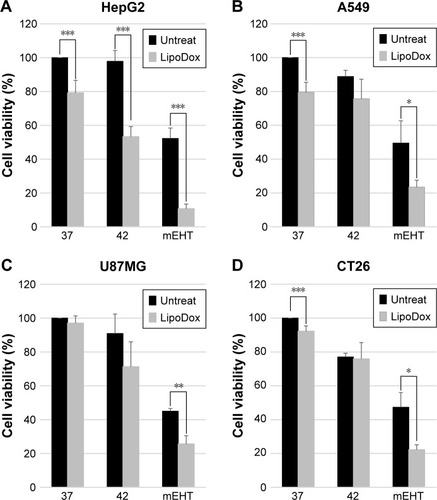
Figure 2 Size distribution and Lipodox®’s doxorubicin-release rate with HT treatment.
Notes: (A) The particle size of Lipodox® was measured by DLS after incubation under three different conditions: in water bath at 37°C as control, in water bath at 42°C, and with mEHT at 42°C for 30 minutes. (B) Free form of doxorubicin was measured in the Lipodox®-containing medium after incubation under different conditions: in water baths at 4°C, 37°C, 42°C, and with mEHT at 42°C for 30 minutes.
Abbreviations: DLS, dynamic light scattering; HT, hyperthermia; Lipodox®, liposome-encapsulated doxorubicin; mEHT, modulated electro-hyperthermia.
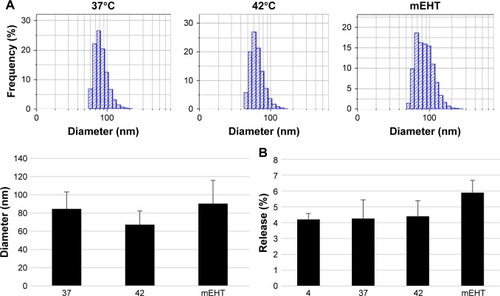
Figure 3 Increased Lipodox® uptake in vitro and in vivo due to mEHT treatment.
Notes: (A) Cellular uptake of Lipodox® by various cancer cells (HepG2, A549, U87MG, and CT26wt). Cells were treated for 24 hours with 50 µM of Lipodox® followed by either incubation in water bath at 37°C as control, in water bath at 42°C, and with mEHT at 42°C for 30 minutes. Flow cytometry was used to quantify the uptake of Lipodox® by the cells. Data represent results from experiments repeated three times independently. (B) Fluorescence microscopy images of HepG2 cells which were treated with Lipodox® at 50 µM for 24 hours, followed by incubation in water bath at 37°C as control, in water bath at 42°C, and with mEHT at 42°C for 30 minutes. Nuclei were stained with DAPI (blue), and doxorubicin was indicated by red fluorescence. Magnification 400×. (C) mEHT increased Lipodox® uptake in vivo. Four hours after Lipodox® intravenous treatment (10 mg/kg), CT26-bearing mice were treated in three groups under incubation in water bath at 37°C as control, in water bath at 42°C, and with mEHT at 42°C for 30 minutes. Fifteen mice were divided into three groups, each containing five mice. The tumors were dissected and the concentration of doxorubicin was measured by spectrofluorometry. *P<0.05, ***P<0.005.
Abbreviations: Lipodox®, liposome-encapsulated doxorubicin; mEHT, modulated electro-hyperthermia.
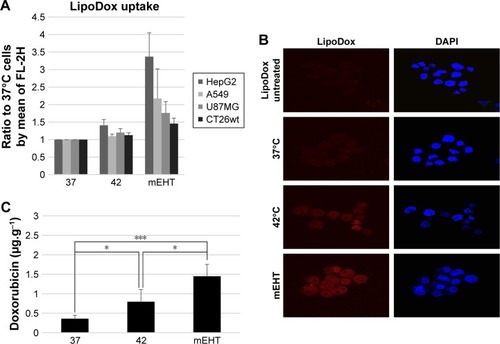
Figure 4 Effect of endocytic-inhibitors on accumulation of Lipodox® and cell viability in HepG2 cells.
Notes: Cells were either untreated or pretreated under separate conditions with various inhibitors. (A) NaN3 as ATPase-inhibitor, (B) CPZ, (C) wortmannin, (D) filipin for 30 minutes at 37°C prior to adding Lipodox® (50 µM). The fluorescence signal was measured following incubation for 3 hours at 37°C in all cases. (E) HepG2 cells for viability assay were cultured for 24 hours after treatment, and viable cell yields were determined by the Trypan Blue exclusion method. Data represent mean ± SD (n=3). *P<0.05 and **P<0.01 compared to control.
Abbreviations: CPZ, chlorpromazine; Lipodox®, liposome-encapsulated doxorubicin; Wort, wortmannin.
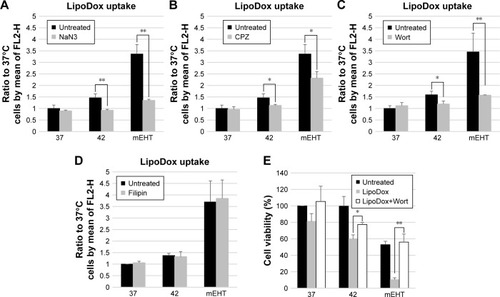
Figure 5 The stimulation of endocytosis signaling pathway with mEHT treatment.
Notes: The roles of (A) cholera toxin B subunit signaling pathway (caveolin pathway), (B) dextran (micropinocytosis), and (C) transferrin (clathrin pathway) in endocytosis of mEHT treatment in HepG2 cells were evaluated. (D) Wortmannin (0.1 µM) was used to observe the dextran uptake inhibition effect. (E) The activation of EGFR was determined by immunoblotting for Y1068 phosphorylation. Lysates of HepG2, A549, and U87MG were harvested after mEHT treatment at 10 minutes, 6 hours, and 24 hours. GAPDH and beta-actin were served as internal control. *P<0.05, ***P<0.005.
Abbreviations: mEHT, modulated electro-hyperthermia; Wort, wortmannin; CB-T, Cholera toxin B subunit; Trf, transferrin.
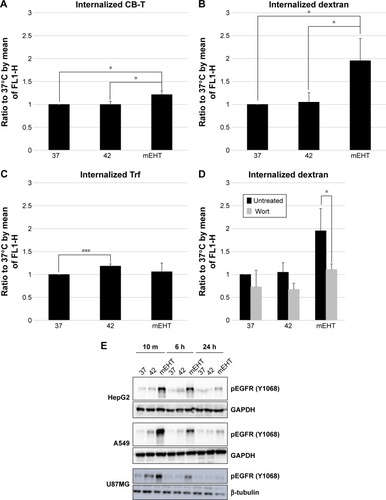
Figure 6 Decreased tumor growth with in vivo treatment of inbred colon cancer mice model.
Notes: CT26-injected BALB/c mice were untreated (control [Ctrl], n=6) or treated under different conditions: WB (n=6), mEHT (n=7), Lipodox® (n=7), dWB (n=7), and Lipodox® plus mEHT (n=7). Tumors were measured at days 0–24 after treatment. Tumor growth curves showed that Lipodox® plus mEHT treatments inhibited tumor growth significantly better than other groups.
Abbreviations: dWB, Lipodox® plus WB; mEHT, modulated electro-hyperthermia; mLD, Lipodox® plus mEHT; WB, water bath.
![Figure 6 Decreased tumor growth with in vivo treatment of inbred colon cancer mice model.Notes: CT26-injected BALB/c mice were untreated (control [Ctrl], n=6) or treated under different conditions: WB (n=6), mEHT (n=7), Lipodox® (n=7), dWB (n=7), and Lipodox® plus mEHT (n=7). Tumors were measured at days 0–24 after treatment. Tumor growth curves showed that Lipodox® plus mEHT treatments inhibited tumor growth significantly better than other groups.Abbreviations: dWB, Lipodox® plus WB; mEHT, modulated electro-hyperthermia; mLD, Lipodox® plus mEHT; WB, water bath.](/cms/asset/e51337e5-8120-4ee5-a9fc-784df52d240d/dijn_a_12190683_f0006_c.jpg)