Figures & data
Figure 1 Schematic representation of LPPC-mediated intracellular protein delivery. Note: LPPC may be used to deliver proteins into cells in vitro (left) or in vivo (right).
Abbreviation: LPPC, liposomes containing polyethylenimine and polyethylene glycol.
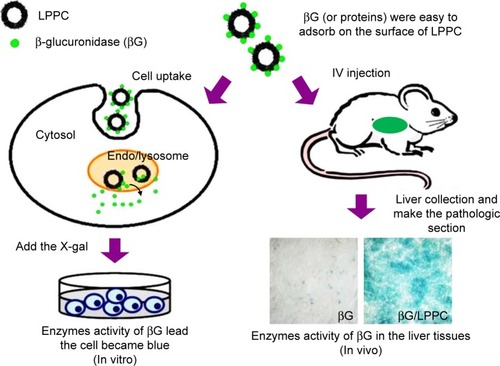
Figure 2 Binding capacity and stability of proteins bound on LPPC.
Notes: (A–C) Protein adsorptions to (A) LPPC, (B) lipofectamine and (C) DOTAP were determined by ITC. Protein–LPPC interactions are indicated by increased ∆Q along with increased amounts of proteins. (D) Increasing amounts of BSA-FITC and βG were added to LPPC (40 µg), and the adsorbed proteins on LPPC were quantified by the Bradford assay. The data showed that LPPC adsorbed ~213 µg or more BSA-FITC and 120 µg of βG. (E) Stability of LPPC/BSA-FITC and (F) LPPC/βG complexes in various NaCl solutions. Spectrofluorometry was utilized to calculate the amount of dissociated BSA-FITC, while a Bradford assay was used to determine the amount of dissociated βG. Representative data are shown as the mean ± SD of three independent experiments.
Abbreviations: βG, β-glucuronidase; DOTAP, 1,2-dioleoyl-3-trimethylammonium-propane; FITC, fluorescein isothiocyanate; ITC, isothermal titration calorimetry; LPPC, liposomes containing polyethylenimine and polyethylene glycol.
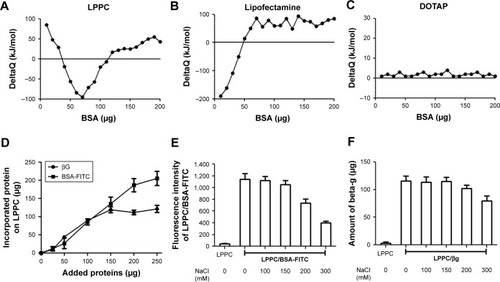
Table 1 The effects of BSA adsorption on the particle size and zeta potential of LPPC
Figure 3 Cytotoxicity of LPPC complexes.
Notes: (A) BALB/3T3 and (B) HepG2 cells were treated with LPPC complexed with different weight ratios of BSA for 48 hours. The viability of treated cells was analyzed by an MTT assay. Each data point represents the mean ± SD of three independent experiments.
Abbreviations: FITC, fluorescein isothiocyanate; LPPC, liposomes containing polyethylenimine and polyethylene glycol complex.
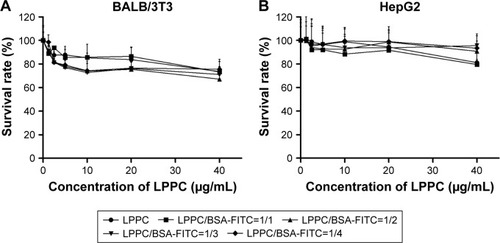
Figure 4 Fluorescence of intracellular LPPC/BSA-FITC complexes in HepG2 cells.
Notes: HepG2 cells were treated with LPPC/BSA-FITC complexes (10:40 µg) or 40 µg of BSA-FITC at 37°C for different amounts of time. The fluorescence of cells was analyzed by flow cytometry. Black lines indicate untreated cells and red lines indicate cells treated with LPPC/BSA-FITC. Representative flow cytometry plots of three independent experiments are shown.
Abbreviations: FITC, fluorescein isothiocyanate; LPPC, liposomes containing polyethylenimine and polyethylene glycol complex.
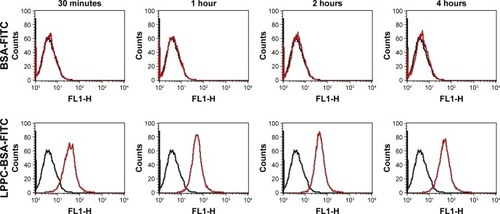
Figure 5 Localization of LPPC/BSA-FITC complexes in HepG2 cells.
Notes: HepG2 cells were untreated (left panels) or treated with BSA-FITC (central panels) or LPPC/BSA-FITC complexes (right panels). The lysosomes and nuclei of the cells were individually stained red and blue, respectively. The cells were observed and imaged by confocal microscopy. Localization of BSA-FITC and lysosomes is indicated by white arrows. The escape of BSA-FITC from the lysosome (at 2 hours postincubation) is indicated by a white arrowhead. Representative images of three independent experiments are shown.
Abbreviations: FITC, fluorescein isothiocyanate; LPPC, liposomes containing polyethylenimine and polyethylene glycol complex.
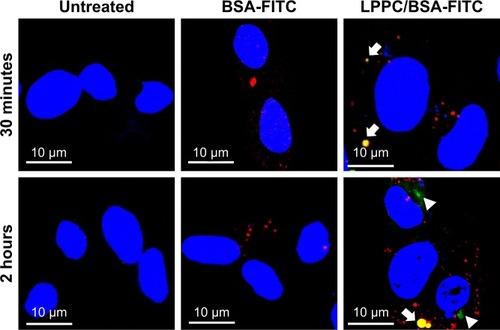
Figure 6 Escape of intracellularly delivered EGFP from LPPC.
Notes: (A) The fluorescence of EGFP cannot be measured, when it is adsorbed to LPPC (right dot), while free EGFP is capable of emitting fluorescence (left dot). (B) HepG2 cells were untreated or treated with free EGFP, empty LPPC, or LPPC/EGFP complexes for different amounts of time. The lysosome (in red color) and nucleus (in blue color) were stained after incubation. The cells were then observed and imaged by confocal microscopy. EGFP molecules dissociated from LPPC are indicated by white arrows. Representative images of three independent experiments are shown.
Abbreviations: EGFP, enhanced green fluorescent protein; FITC, fluorescein isothiocyanate; LPPC, liposomes containing polyethylenimine and polyethylene glycol complex.
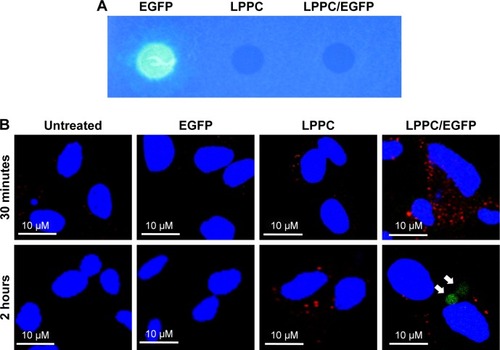
Figure 7 Enzymatic activity of delivered β-glucuronidase in vitro.
Notes: HepG2 cells were treated with free βG, empty LPPC, or LPPC/βG for 4 hours. The cells were fixed and perforated by Triton X-100 for staining of βG activity with X-gluc (in blue). Representative images of three independent experiments are shown.
Abbreviations: βG, β-glucuronidase; LPPC, liposomes containing polyethylenimine and polyethylene glycol complex.
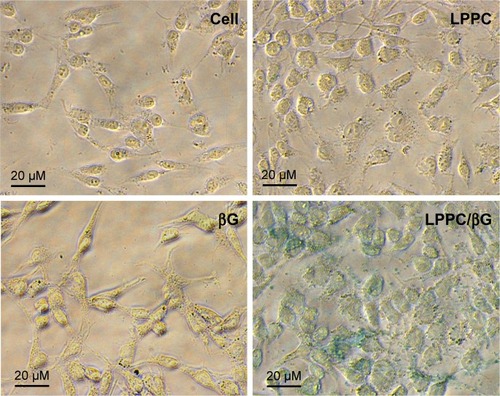
Figure 8 Enzymatic activity of delivered βG in vivo.
Notes: (A) The activity of LPPC-delivered βG in the liver was determined. The livers were sectioned for staining of βG activity with X-gluc (in blue). (B) Biodistribution of LPPC/βG by measuring the concentration of βG. BALB/c mice were intravenously injected with free βG, empty LPPC, or LPPC/βG for 48 hours. Mice were sacrificed, and the organs were collected. The concentration of βG in various organs was analyzed.
Abbreviations: βG, β-glucuronidase; LPPC, liposomes containing polyethylenimine and polyethylene glycol complex.
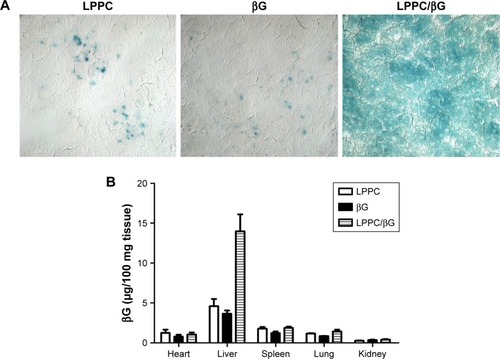
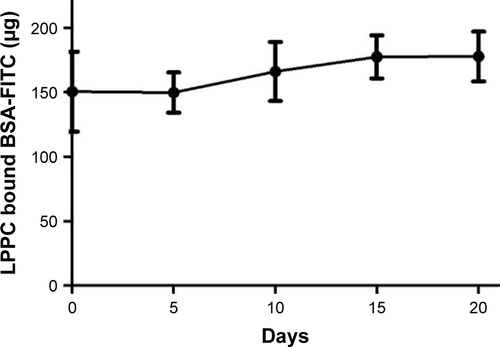
Figure S1 The stability of LPPC/BSA-FITC in physiological conditions.
Notes: LPPC/BSA-FITC complexes were incubated in DMEM growth medium with 10% FBS (pH=7). The amount of LPPC-bound BSA-FITC was determined using a Coomassie Plus Bradford™ Assay Kit.
Abbreviations: FITC, fluorescein isothiocyanate; LPPC, liposomes containing polyethylenimine and polyethylene glycol.