Figures & data
Figure 1 Schematic diagram of Cur-CA4P/GA LPs.
Notes: Cur (green) and CA4P (red) were encapsulated into the hydrophobic shell and hydrophilic core of the LPs, respectively. GA was linked to the LPs by conjugation with DSPE-PEG2,000.
Abbreviations: CA4P, combretastatin A4 phosphate; Cur, curcumin; LPs, liposomes; GA, glycyrrhetinic acid; DSPE, 1,2-distearoyl-sn-glycero-3-phosphoethanolamine; PEG, polyethylene glycol.
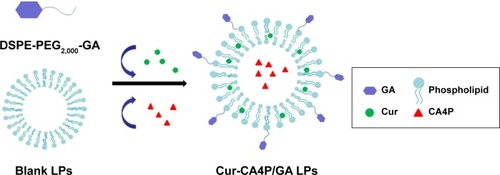
Figure 2 Synthesis of GA-N (A) and DSPE-PEG2,000-GA (B).
Abbreviations: GA-N, diamine-modified glycyrrhetinic acid; DSPE, 1,2-distearoyl-sn-glycero-3-phosphoethanolamine; PEG, polyethylene glycol; NHS, N-hydroxysuccinimide; EDC, 1-ethyl-3-(3-dimethylaminopropyl)carbodiimide.
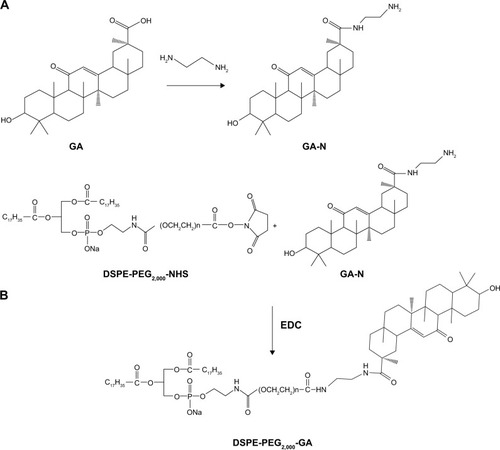
Figure 3 1H NMR spectra of DSPE-PEG2,000-NHS, GA-N, and DSPE-PEG2,000-GA.
Note: Peaks of GA-N at 0.7–1.5 ppm (a) and peaks of DSPE-PEG2,000-NHS at 3.6 ppm (b).
Abbreviations: NMR, nuclear magnetic resonance; DSPE, 1,2-distearoyl-sn-glycero-3-phosphoethanolamine; PEG, polyethylene glycol; NHS, N-hydroxysuccinimide; GA-N, diamine-modified glycyrrhetinic acid.
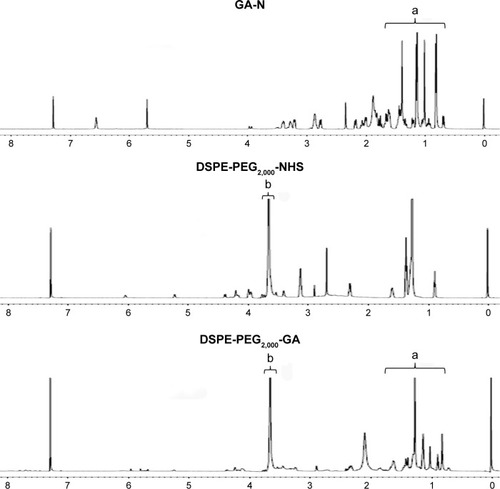
Table 1 Characterization of various LP formulations
Figure 4 Characterization of LPs at various Cur:CA4P ratios.
Notes: Particle size, ζ-potential (A), encapsulation efficiency (B), and loading content (C) of the LPs. Values expressed as means ± SD.
Abbreviations: LPs, liposomes; Cur, curcumin; CA4P, combretastatin A4 phosphate; DLS, dynamic light scattering.
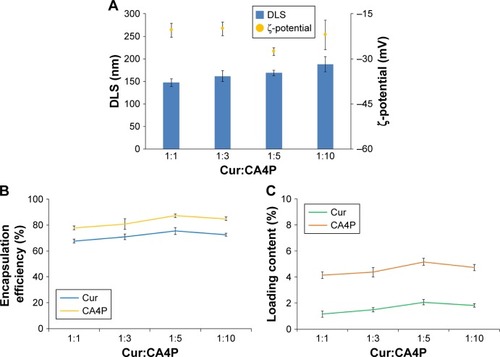
Figure 5 Characteristics of blank LPs and Cur-CA4P/GA LPs.
Notes: (A, B) Transmission electron microscopy; (C) particle-size distribution of Cur-CA4P/GA LPs.
Abbreviations: LPs, liposomes; Cur, curcumin; CA4P, combretastatin A4 phosphate; GA, glycyrrhetinic acid.
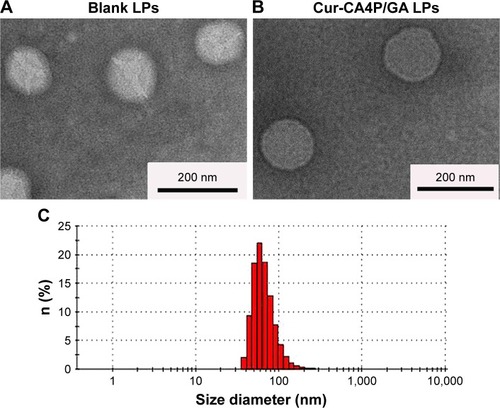
Figure 6 Characterization of Cur-CA4P GA LP formulations.
Notes: Size distribution and ζ-potential of Cur-CA4P/GA LPs; (A) EE and LC of Cur (B) and CA4P (C) for 2 weeks. Values expressed as means ± SD.
Abbreviations: Cur, curcumin; CA4P, combretastatin A4 phosphate; GA, glycyrrhetinic acid; LPs, liposomes; EE, encapsulation efficiency; LC, loading content; DLS, dynamic light scattering.
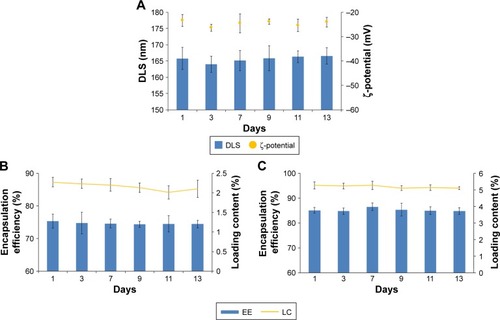
Figure 7 In vitro release profiles of Cur and CA4P from Cur-CA4P/GA LPs.
Notes: Release medium: PBS buffer (pH 7.4; 1% Tween 80 and 20% anhydrous ethanol), temperature 37°C. Data expressed as mean ± SD (n=3).
Abbreviations: Cur, curcumin; CA4P, combretastatin A4 phosphate; GA, glycyrr-hetinic acid; LPs, liposomes.
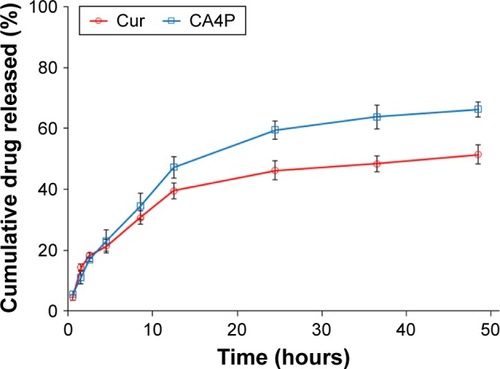
Figure 8 Fluorescence microscopy of BEL7402 cells incubated with FITC LPs (A) and FITC-GA LPs (B). Note: FITC (green fluorescence) and DAPI channels for nucleus (blue fluorescence) were presented.
Abbreviations: FITC, fluorescein isothiocyanate; LPs, liposomes; GA, glycyrrhetinic acid.
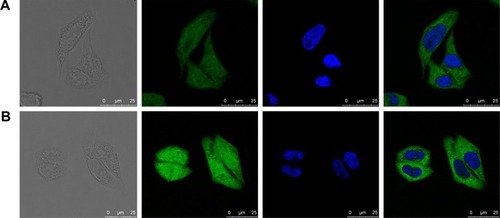
Figure 9 Viability of cells treated with various combinations.
Notes: (A, B) Blank GA LPs, free Cur, CA4P, free Cur + CA4P, Cur-CA4P LPs, or Cur-CA4P/GA LPs in BEL7402 and B16 cells for 24 hours. (C, D) Viability of cells treated with various formulations against BEL7402 and B16 cells for 24, 48, and 72 hours. *P<0.05, **P<0.01 (A, B). *Cur-CA4P LPs vs free Cur + CA4P; **Cur-CA4P/GA LPs vs free Cur + CA4P (C, D).
Abbreviations: GA, glycyrrhetinic acid; LPs, liposomes; Cur, curcumin; CA4P, combretastatin A4 phosphate.
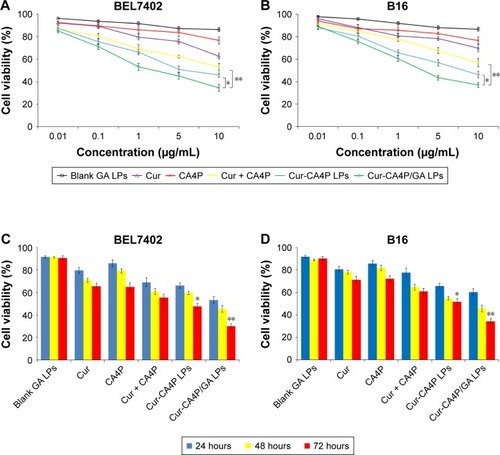
Figure 10 Inhibition of cancer cell migration was evaluated via wound-healing assays of BEL7402 (A) and B16 cells (B). Migration ratios vs average width of scar from 0 to 24 hours was measured by Image-Pro Plus 6.0 (C, D). Wound healing assays at 0 and 24 hours following treatment with various formulations observed under 10×40 and 10×10 magnification. *P<0.05, free Cur + CA4P vs control group; **P<0.01, Cur-CA4P LPs vs control group, Cur-CA4P/GA LPs vs control group.
Abbreviations: Cur, curcumin; CA4P, combretastatin A4 phosphate; LPs, liposomes; GA, glycyrrhetinic acid.
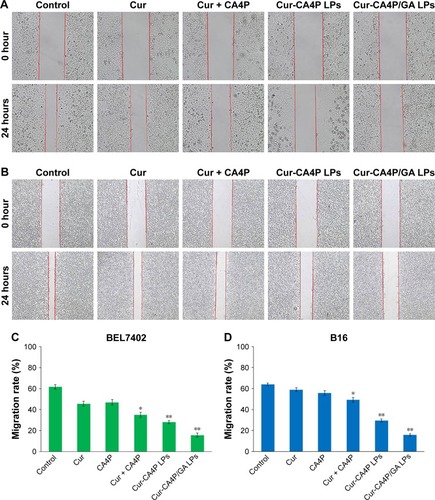
Figure 11 NIRF images of H22 tumor-bearing mice after injection of free DiR and DiR-GA LPs.
Abbreviations: GA, glycyrrhetinic acid; LPs, liposomes; NIRF, near-infrared fluorescence imaging.
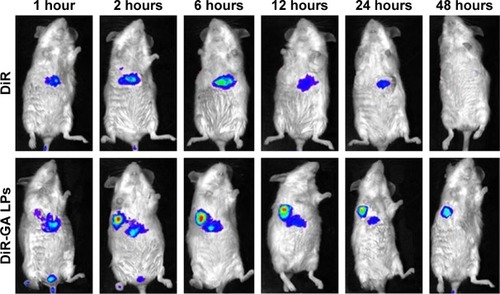
Figure 12 (A) Mice were weighed at the same time. (B) Mice were killed and tumor blocks removed for photography. (C) Tumor volume changes in H22-bearing BALB/c mice after intravenous injection with normal saline and various drug-preparation groups. (D) Tumor growth–inhibition rate was calculated according to the formula. Tumor growth was monitored and plotted as tumor volume. Tumor growth–inhibition rate was calculated by weighing the tumor mass. Cur-CA4P LPs vs control group, Cur-CA4P/GA LPs vs control group. *P<0.05; **P<0.01.
Abbreviations: Cur, curcumin; CA4P, combretastatin A4 phosphate; LPs, liposomes; GA, glycyrrhetinic acid.
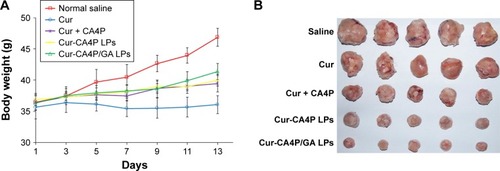
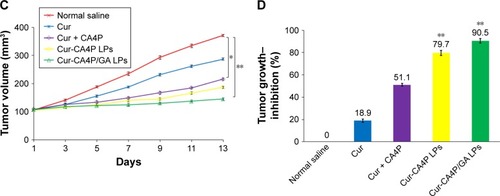
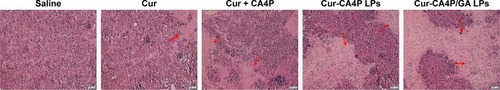
Figure 13 Histological analyses of tumor tissue using H&E staining.
Notes: Scale bar 100 µm. Red arrows highlight immunohistochemical characteristics.
Abbreviations: LPs, liposomes; GA, glycyrrhetinic acid; CA4P, combretastatin A4 phosphate; Cur, curcumin.