Figures & data
Figure 1 Protocol of EAE induction and ferucarbotran administration.
Notes: Female C57BL/6 mice were either left unimmunized (NA; n=8) or subcutaneously immunized with MOG35–55 emulsion (MOG; 0.2 mg/0.2 mL/mouse) on day 0 and then received two intraperitoneal injections of PTX (100 ng/mouse) at 3 and 27 hours post-immunization to induce EAE. A single dose of IONP (20 mg/kg of ferucarbotran, 0.25 mL/mouse) and/or VH (saline, 0.25 mL/mouse) was intravenously administrated to EAE mice on day 18. Clinical symptoms of EAE were daily monitored for 30 days. Three mice in the VH and IONP groups were killed on day 21 for the detection of iron in the brain and spinal cord. The other mice were killed on day 30 and their spinal cords were isolated for further experiments.
Abbreviations: EAE, experimental autoimmune encephalomyelitis; IHC, immunohistochemistry; IONP, iron oxide nanoparticle; LFB, Luxol fast blue; MOG, myelin oligodendrocyte glycoprotein; NA, naïve; PTX, pertussis toxin; VH, vehicle.
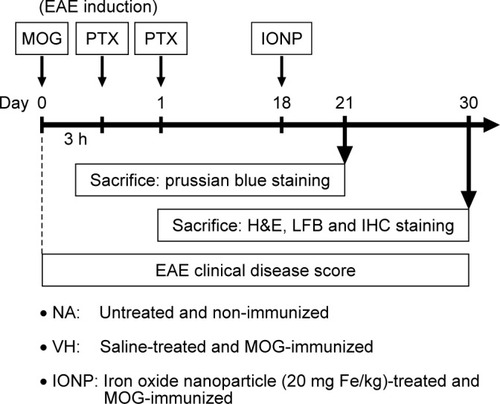
Figure 2 Detection of iron in the CNS of EAE mice.
Notes: Tissue sections of the brain and spinal cord obtained from VH- and ferucarbotran-treated EAE mice killed on day 21 were stained with Prussian blue. The regions between (A) the midbrain and the brainstem and (B) the lumbar region of the spinal cord are shown. The right panels are enlarged areas of dashed boxes that show negative and positive staining (blue) for iron in the VH and IONP groups, respectively. Similar results were observed in three individual mice per group.
Abbreviations: CNS, central nervous system; EAE, experimental autoimmune encephalomyelitis; IONP, iron oxide nanoparticle; VH, vehicle.
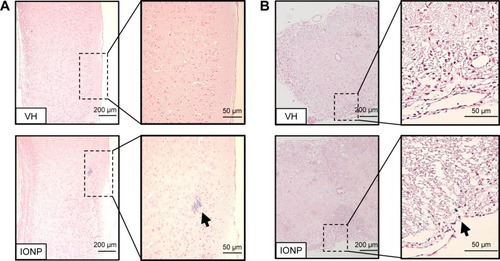
Figure 3 Treatment with ferucarbotran increased the clinical scores of EAE mice.
Notes: (A) Daily clinical scores of the NA (n=8), VH (n=10) and IONP (n=11) groups are shown. Data are expressed as the mean ± standard error. (B) Distribution of mean clinical score and (C) cumulative clinical score of individual mice in the VH and IONP groups from day 18 to 30 are shown. *P<0.05 compared to the VH group. The results are representative of three independent experiments.
Abbreviations: EAE, experimental autoimmune encephalomyelitis; IONP, iron oxide nanoparticle; NA, naïve; VH, vehicle.
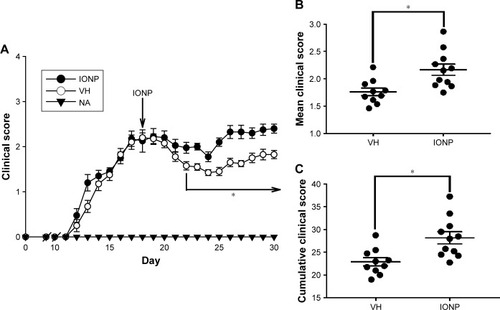
Figure 4 Treatment with ferucarbotran exacerbated demyelination in EAE mice.
Notes: (A) Representative tissue sections stained with LFB are shown. Areas marked by dashed line show normal myelinated regions in the NA group. Red arrows indicate regions with marked demyelination in the VH and IONP groups. (B) The data are expressed as the mean ± standard error of 8–11 samples per group. *P<0.05 compared to the VH group. The results are representative of three independent experiments.
Abbreviations: EAE, experimental autoimmune encephalomyelitis; IONP, iron oxide nanoparticle; LFB, Luxol fast blue; NA, naïve; VH, vehicle.
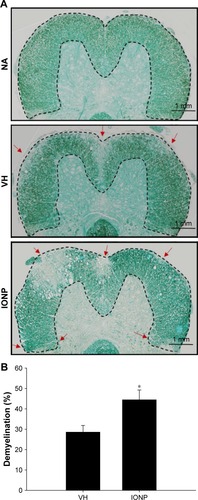
Figure 5 Treatment with ferucarbotran augmented the infiltration of inflammatory cells into the spinal cord of EAE mice.
Notes: (A) Representative tissue sections stained with H&E are shown. The lower panels are enlarged images of dashed boxes that show a more severe infiltration of inflammatory cells in the IONP group. (B) Pathological scores of the inflammatory cell infiltration, assessed as described in “Materials and methods” section. The pathological scores were expressed as the mean ± standard error of 8–11 samples per group. *P<0.05 compared to the VH group. The results are representative of three independent experiments.
Abbreviations: EAE, experimental autoimmune encephalomyelitis; IFN-γ, interferon-γ; IONP, iron oxide nanoparticle; NA, naïve; VH, vehicle.
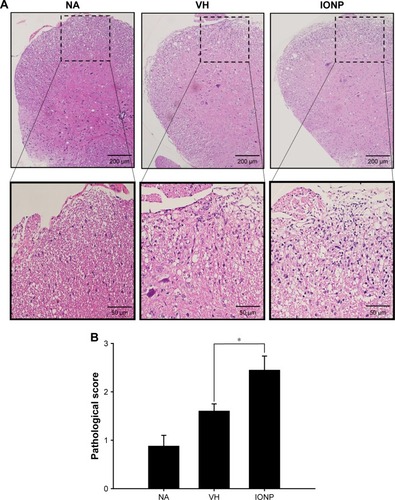
Table 1 Immunohistochemical staining of CD3, Iba-1 and inflammation-related cytokines in the spinal cord of EAE mice
Figure 6 Treatment with ferucarbotran increased the number of Iba-1+TNF-α+ cells in the spinal cord of EAE mice.
Notes: (A) Representative tissue sections double stained for Iba-1 (brown) and TNF-α (red) are shown. The lower panels are enlarged images of the dashed boxes. Arrows indicate Iba-1+TNF-α+ cells. (B) The number of double-positive cells is expressed as the mean ± standard error of 8–11 samples per group. *P<0.05 compared to the VH group. The results are representative of three independent experiments.
Abbreviations: EAE, experimental autoimmune encephalomyelitis; IFN-γ, interferon-γ; IONP, iron oxide nanoparticle; NA, naïve; TNF-α, tumor necrosis factor-α; VH, vehicle.
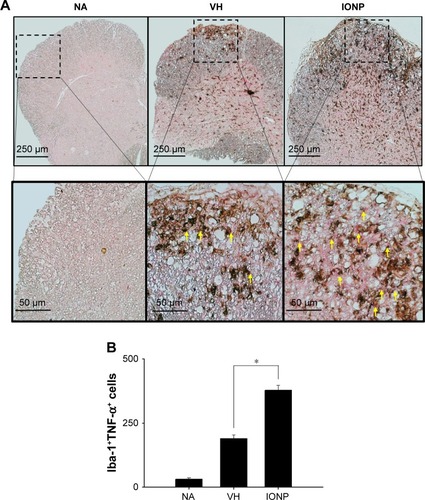
Figure 7 Treatment with ferucarbotran increased the mRNA expression of IFN-γ, IL-6 and TNF-α in the spinal cord.
Notes: Mice were treated as the protocol described in “Materials and methods” section. Total RNA from the spinal cord was extracted for the measurement of mRNA expression by RT-PCR. (A) Representative photographs of RT-PCR products are shown. The expression levels of (B) TNF-α, (C) IL-6 and (D) IFN-γ are quantified and expressed as the mean ± standard error of 3–15 samples per group. *P<0.05 compared to the VH group.
Abbreviations: IFN-γ, interferon-γ; IONP, iron oxide nanoparticle; NA, naïve; TNF-α, tumor necrosis factor-α; VH, vehicle.
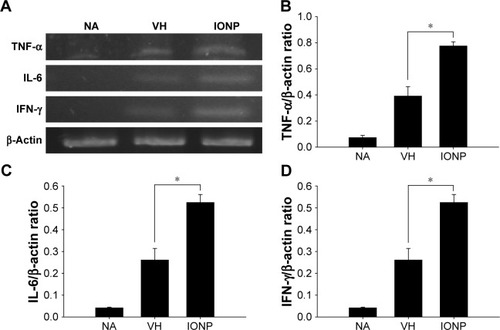
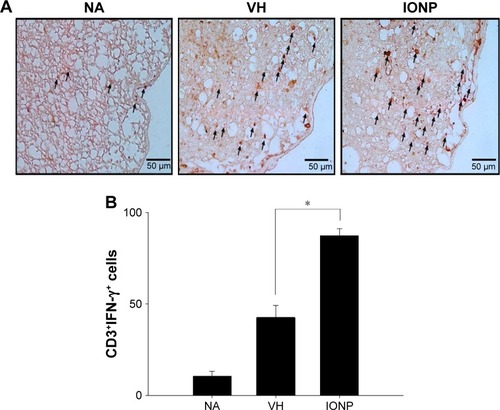
Figure 8 Treatment with ferucarbotran increased the number of CD3+IFN-γ+ cells in the spinal cord of EAE mice.
Notes: (A) Representative tissue sections double stained for CD3 (brown) and IFN-γ (red) are shown. The lower panels are enlarged images of the dashed boxes. Arrows indicate CD3+IFN-γ+ cells. (B) The number of double-positive cells is expressed as the mean ± standard error of 8–11 samples per group. *P<0.05 compared to the VH group. The results are representative of three independent experiments.
Abbreviations: EAE, experimental autoimmune encephalomyelitis; IFN-γ, interferon-γ; IONP, iron oxide nanoparticle; NA, naïve; VH, vehicle.