
Figures & data
Figure 1 FTIR spectrum of membranes: a: NSSM, b: NSSM-OH, c: NSSM-MWCNT.
Abbreviations: FTIR, Fourier-transform infrared spectroscopy; MWCNT, multi-walled carbon nanotube; NSSM, nanoporous solid-state membrane.
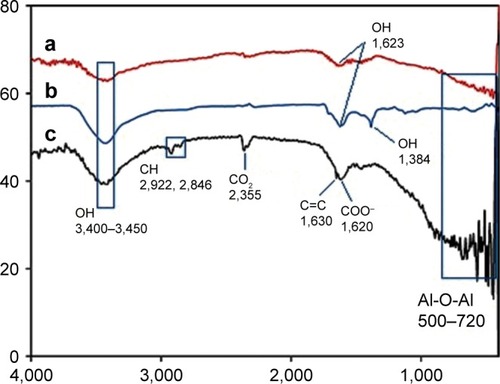
Figure 2 EDAX point data and EDAX image of membrane (A, B) NSSM, (C, D) NSSM-MWCNT which were anodized in aqueous solutions of acid, 100 V and 25°C.
Abbreviations: EDAX, energy dispersive X-ray; MWCNT, multi-walled carbon nanotube; NSSM, nanoporous solid-state membrane.
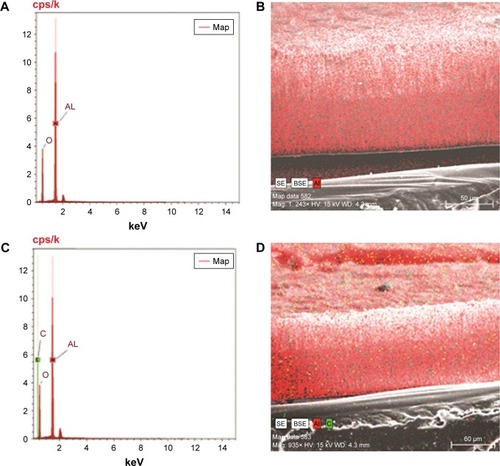
Figure 3 SEM image of surface and cross-section (A, B) of NSSM and (C, D) NSSM-MWCNT membranes which were anodized in aqueous solutions of acid, 100 V and 25°C.
Abbreviations: MWCNT, multi-walled carbon nanotube; NSSM, nanoporous solid-state membrane; SEM, scanning electron microscopy.
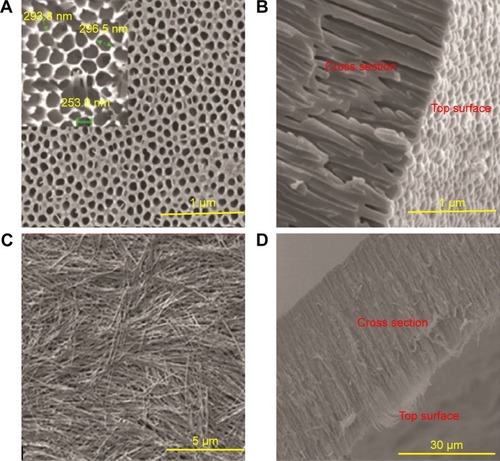
Figure 4 AFM: two-dimensional (A and B) three-dimensional images of NSSM, (C) two-dimensional and (D) three-dimensional images of NSSM-MWCNT (500×500 nm), (E) three-dimensional images of NSSM and (F) NSSM-MWCNT (100×100 nm).
Abbreviations: AFM, atomic force microscopy; MWCNT, multi-walled carbon nanotube; NSSM, nanoporous solid-state membrane.
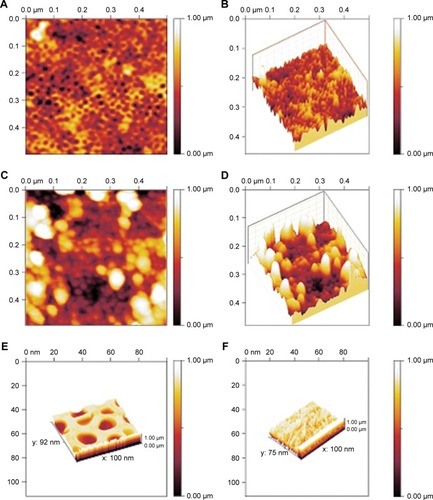
Figure 5 WCA and SFE of NSSM and NSSM-MWCNT membranes.
Abbreviations: MWCNT, multi-walled carbon nanotube; NSSM, nanoporous solid-state membrane; SFE, surface free energy; WCA, water contact angle.
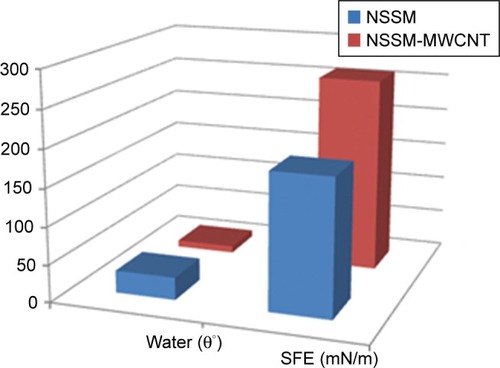
Figure 6 Surface SEM image of NSSM (A) 5.00 kx, (B) 200 kx, and NSSM-MWCNT (C) 30.00 kx and (D) 50.00 kx after biofilm assay.
Abbreviations: E. coli, Escherichia coli; MWCNT, multi-walled carbon nanotube; NSSM, nanoporous solid-state membrane; SEM, scanning electron microscopy; S. aureus, Staphylococcus aureus.
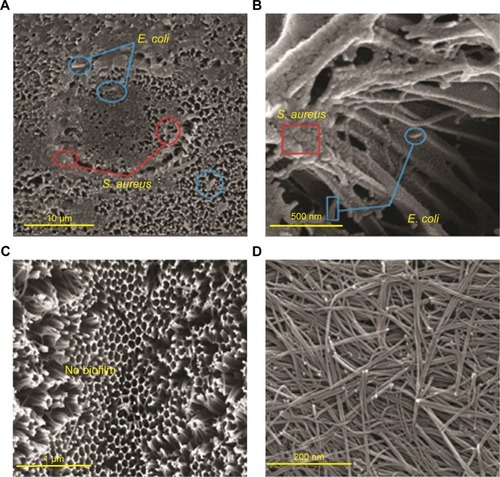
Figure 7 Results flow cytometry analysis (A) NSSM-E. coli, (B) NSSM-S. aureus, (C) NSSM-MWCNT-E. coli and (D) NSSM-MWCNT- S. aureus.
Abbreviations: PI, propidium iodide; SSC-H, side scatter height.
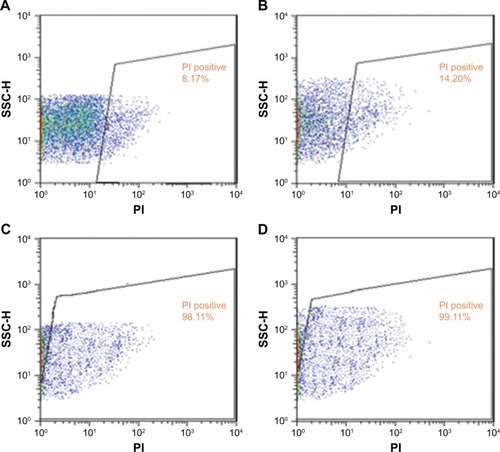
Figure 8 Percentage of bacterial viability in membrane specimens.
Abbreviations: MWCNT, multi-walled carbon nanotube; NSSM, nanoporous solid-state membrane.

Figure 9 FTIR spectrum of NSSM-MWCNT membrane, which is absorbed by bacteria (1.5×10⁸ CFU/mL).
Abbreviations: FTIR, Fourier-transform infrared spectroscopy; MWCNT, multi-walled carbon nanotube; NSSM, nanoporous solid-state membrane.
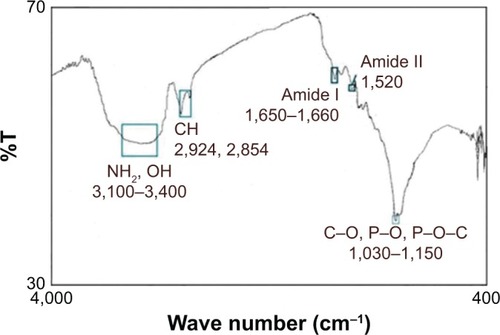
Figure 10 SEM images of membrane modified with carbon nanotube before (A) and after coming into contact with bacteria (B) and normal E. coli (C).
Abbreviations: E. coli, Escherichia coli; SEM, scanning electron microscopy.
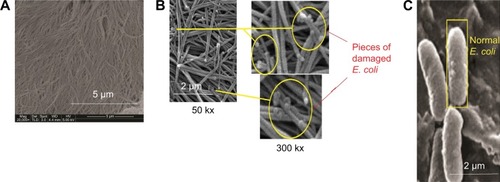
Figure 11 Pesudo-first-order (A) and pesudo-second-order (B) kinetic models plot for the absorption of E. coli of 1.5×10⁸ CFU/mL.
Abbreviation: E. coli, Escherichia coli.
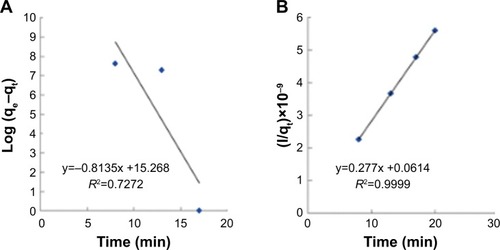
Figure 12 Isotherm models plot (A) Freundlich and (B) Langmuir for the absorption of E. coli at concentrations of 1.5×10⁸, 107, 106, 105, 104, and 103 CFU/mL, 13 minutes and flow rate of 0.05 mL/min.
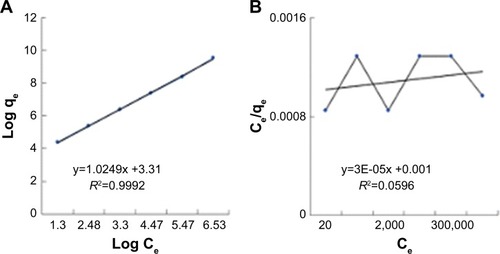
Table 1 The constants of Freundlich and Langmuir models
Table 2 Thermodynamic parameters
Figure S1 The general schematic diagram of the fabrication and modification process of membranes.
Abbreviations: MWCNT, multi-walled carbon nanotube; NSSM, nanoporous solid-state membrane.
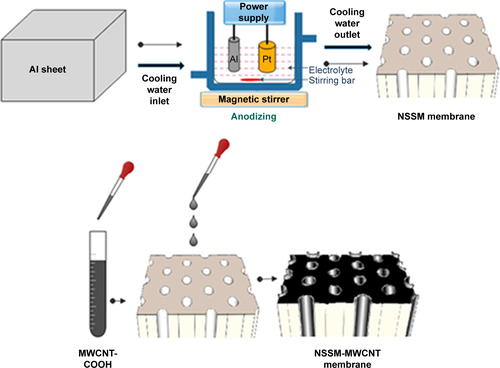
Figure S2 Absorption of E. coli on the membranes in dead-end cell.
Abbreviations: E. coli, Escherichia coli; MWCNT, multi-walled carbon nanotube; NSSM, nanoporous solid-state membrane.
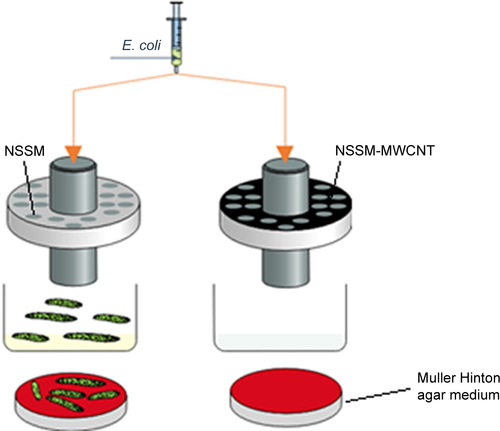
Figure S3 Plate count method in absorption studies.
Note: Counting the colonies of concentration (A) 1.5 × 10⁸ and (B) 107.
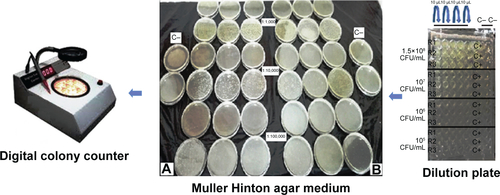
Table S1 Parameters of acid-base Van Oss method