Figures & data
Figure 1 Establishment of double-gene expression in Huh7 cells.
Notes: (A) CMV promoter driven hNIS and EGFP was expressed in cells. (B) Western blotting analysis for the finding of NIS proteins from Huh7/NIS cells, not from Huh7 cells. (C) Confocal microscopy analysis to detect NIS and GFP protein in Huh7/NIS cells, not from Huh7 cells.
Abbreviations: CMV, cytomegalovirus; IRES, internal ribosomal entry site.
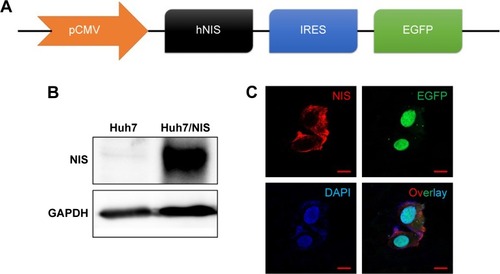
Figure 2 Characterization of EVs isolated from Huh7/NIS.
Notes: (A) Morphology of EV-Huh7/NIS confirmed by transmission electron microscopy, arrow indicates the lipid bilayer (scale bar: 100 nm). (B) Size and Zeta potential of EV-Huh7/NIS determined by ELS (n=3; average diameter: 169.2±71.5 nm). (C) Western blot analysis of EV-Huh7/NIS and Huh7/NIS.
Abbreviations: EVs, extracellular vesicles; ELS, electrophoretic light scattering.
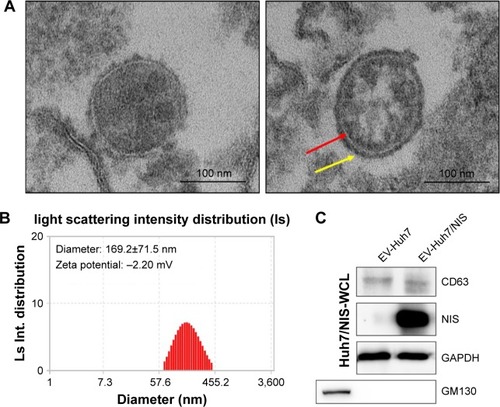
Figure 3 EV-mediated transfer of NIS protein to cells enhanced 125I uptake.
Notes: (A) Western blot analysis of Huh7 cells after EV-Huh7/NIS (0–40 μg/mL) treatment for 24 hours. (B) Quantification of band intensity by GelQuant software represented in bar graph. (C) 125I uptake assay for Huh7 cells after EV-Huh7/NIS (0–40 μg/mL) treatment for 24 hours (n=5). Mean ± SD of experiments is shown. Student’s t-test was used.
Abbreviation: EV, extracellular vesicle.
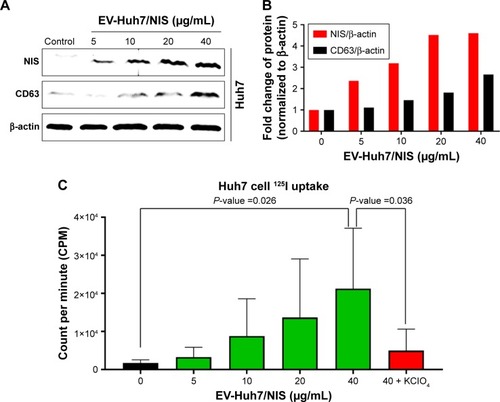
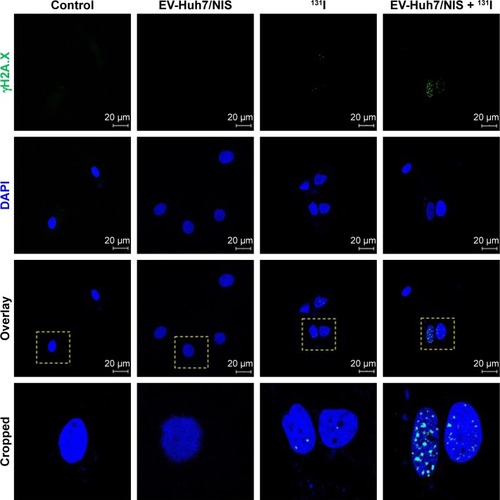
Figure 4 Effect of EV-Huh7/NIS, 131I, 131I-mediated effects by the EV-Huh7/NIS pretreatment of Huh7 cells.
Notes: γH2A.X and DAPI were visualized by blue and green, respectively (scale bar: 20 μm). The yellow dotted square indicates the cropping region of overlay images.
Abbreviation: EV, extracellular vesicle.