Figures & data
Table 1 Variable process parameters
Table 2 Fixed process parameters
Figure 1 Response surface plots for particle size as a function of (A) pressure and concentration, (B) temperature and concentration, and (C) temperature and pressure.
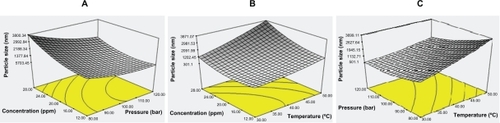
Figure 2 Scanning electron microscopic images of nanoencapsulated paracetamol inside L-polylactide at different process parameters.
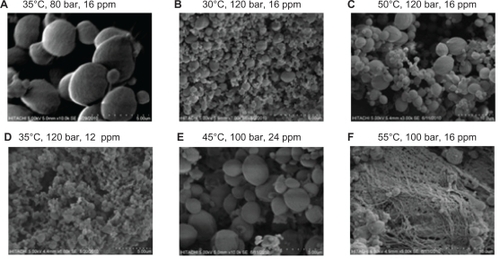
Figure 3 Thermogravimetric analysis of pure paracetamol, pure L-polylactide, and encapsulated paracetamol inside L-polylactide.
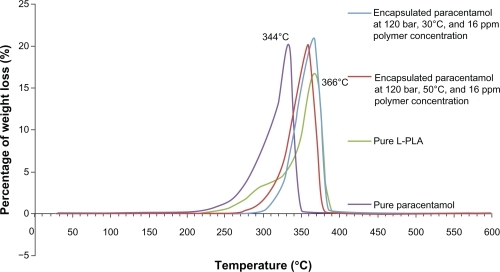
Figure 4 Zeta potential distribution graph of nanoencapsulated paracetamol inside L-polylactide.
Notes: The nanoparticles had a large negative zeta potential (−33 ±3 mV) as shown in Figure 4 due to the presence of carboxyl end groups of the L-polylactide chain. Sustained release of paracetamol in phopshate-buffered saline was investigated over 4 weeks. The first burst happened after 1 week and the cumulative paracetamol release versus time are shown in .
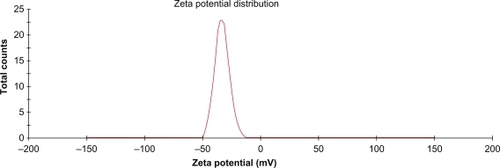
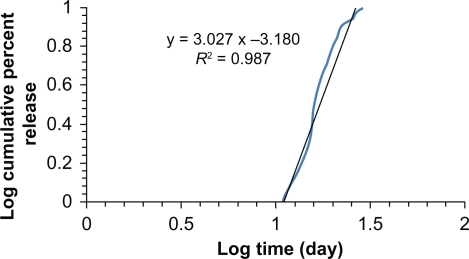
Figure 5 In vitro release profile of paracetamol encapsulated in L-polylactide based on the Korsmeyer–Peppas model.