Figures & data
Figure 1 Illustration of E-selectin-targeting liposomes (T-AC-Lipo) simultaneously encapsulating Ato and Cur to treat atherosclerotic ApoE knockout mice.
Abbreviations: Ato, atorvastatin calcium; Cur, curcumin; Esb peptide, E-selectin-binding peptide; ICAM-1, intercellular cell adhesion molecule-1; IL-6, interleukin 6; MCP-1, monocyte chemotactic protein 1; T-AC-Lipo, targeting-ligand-modified atorvastatin calcium- and curcumin-loaded liposome.
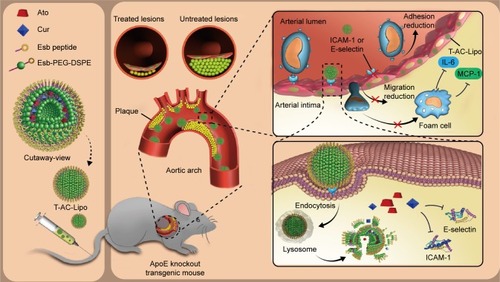
Table 1 Particle size, zeta potential, and curcumin and atorvastatin calcium loading content and efficiency of B-Lipo, C-Lipo, A-Lipo, AC-Lipo, and T-AC-Lipo
Figure 2 Particle size (A) and transmission electron microscopic image (B) of the targeting liposomes encapsulating atorvastatin calcium and curcumin (T-AC-Lipo).
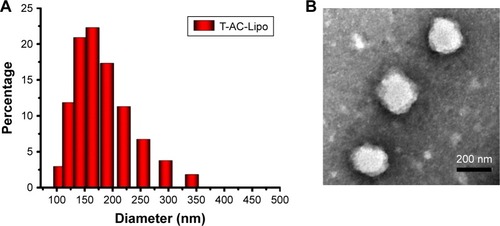
Figure 3 (A) HAEC viability following treatment with B-Lipo, C-Lipo, and A-Lipo at various concentrations of liposomes, Ato, and Cur. The Cur and Ato loading content were 4.39% and 4.01%, respectively. (B) HAEC viability following treatment with A-Lipo, AC-Lipo, and T-AC-Lipo. Data were generated by MTT assay (mean ± SE; n=3).
Abbreviations: A-Lipo, atorvastatin calcium-loaded liposome; Ato, atorvastatin calcium; B-Lipo, blank liposome; C-Lipo, Cur-loaded liposome; Cur, curcumin; AC-Lipo, atorvastatin calcium- and curcumin-loaded liposome; HAEC, human aortic endothelial cell; T-AC-Lipo, targeting-ligand (Esb peptide)-modified atorvastatin calcium- and curcumin-loaded liposome.
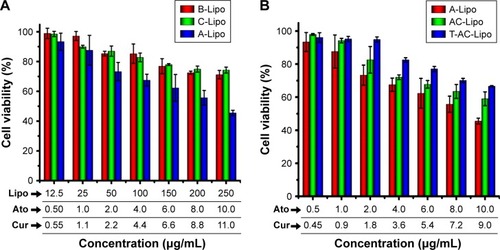
Figure 4 (A) Confocal laser microscopic images of human aortic endothelial cells incubated with AC-Lipo (nontargeted group), T-AC-Lipo (targeted group), and T-AC-Lipo+T (competitive inhibition group, preincubated with 1 µg/mL targeting peptide Esb before treatment with T-AC-Lipo). Nuclei were stained with DAPI (blue fluorescence). Cur emits green fluorescence. Scale bars, 10 µm. (B) Quantitative analysis of transfection efficiency by flow cytometry. The statistical significance was analyzed using the Student’s t-test. Data are presented as mean ± SD (n=3), *P<0.05. Cur concentration was 7.2 µg/mL per well. Before transfection with various liposomes, cells were preincubated with 1 µg/mL lipopolysaccharide for 4 hours.
Abbreviations: AC-Lipo, atorvastatin calcium- and curcumin-loaded liposome; Cur, curcumin; T-AC-Lipo, targeting-ligand-modified atorvastatin calcium- and curcumin-loaded liposome.
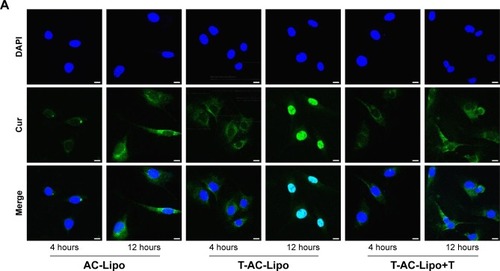
Figure 5 (A) The synergistic effect of Ato and Cur on E-selectin and ICAM-1 gene expression in HAECs determined by real-time quantitative PCR (mean ± SD; n=3; *P<0.05 and #P<0.05, compared to AC-Lipo). After preincubation with 1 µg/mL LPS for 4 hours, cells were transfected with various liposomes and then harvested to evaluate gene expression 24 hours after transfection. (B) Evaluation of E-selectin and ICAM-1 protein expression in HAECs treated with various liposomes by immunofluorescence assay. Yellow and pink fluorescence represent E-selectin and ICAM-1 proteins, respectively. Scale bars, 10 µm. (C) ROS levels in HAECs treated with various liposome medicines determined by flow cytometry. Liposomes were used at 200 µg/mL, where applied. Ato was used at 8.0 µg/mL in cells treated with A-Lipo and AC-Lipo and at 6.0 µg/mL in T-AC-Lipo-treated cells. Cur was used at 7.2 µg/mL for cells treated with A-Lipo, AC-Lipo, or T-AC-Lipo. All groups except controls were pretreated with 1 µg/mL LPS for 4 hours.
Abbreviations: A-Lipo, atorvastatin calcium-loaded liposome; AC-Lipo, atorvastatin calcium- and curcumin-loaded liposome; HAEC, human aortic endothelial cell; ICAM-1, intercellular cell adhesion molecule-1; LPS, lipopolysaccharide; ROS, reactive oxygen species; T-AC-Lipo, targeting-ligand-modified atorvastatin calcium- and curcumin-loaded liposome.
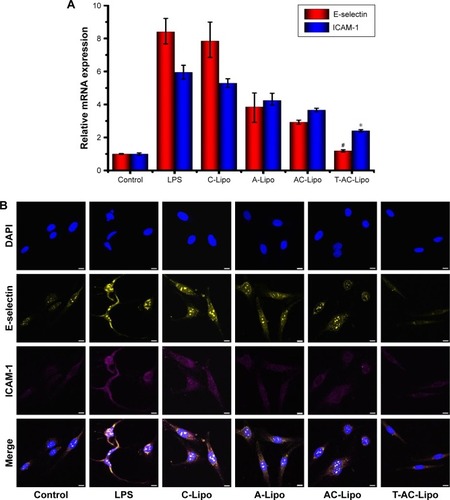
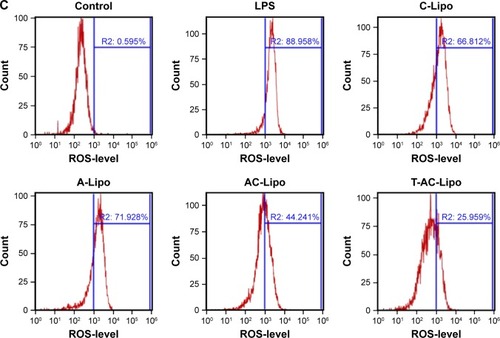
Figure 6 Oil-Red-O-stained thoracic aorta (A) and H&E-stained aortic root lesion (B) images for histologic analysis of atherosclerosis in ApoE knockout mice 30 days after treatment with various liposomes. Lipids in atherosclerotic lesions were stained red with Oil-Red-O in (A). The dashed green and blue rectangular areas in the control group section (ApoE knockout mouse) and the dashed red and dark blue rectangular areas in the T-AC-Lipo treatment group section are magnified in (B). The dashed red and green arrows indicate foam cells and cholesterol clefts, respectively. Infiltrating macrophages in atherosclerotic lesions were labeled with Mac-3 antibody by immunohistochemistry staining (C). Red dashed arrows indicate macrophages in the plaques. (D) and (E) Quantitative analysis of the areas of red atherosclerotic lesions in (n=3) and the cross-sectional areas of atherosclerotic lesions in (n=3), respectively. *P<0.05 compared to other treatments. WT (C57BL/6) mouse group. Control group, atherosclerotic mouse model (ApoE knockout mouse). Scale bars, 50 µm. Liposome concentration, 45 mg/kg body weight. Cur concentration, 2 mg/kg body weight. Ato concentration for A-Lipo and AC-Lipo treatment groups, 1.8 mg/kg body weight. Ato concentration for T-AC-Lipo treatment group, 1.4 mg/kg body weight.
Abbreviations: A-Lipo, atorvastatin calcium-loaded liposome; AC-Lipo, atorvastatin calcium- and curcumin-loaded liposome; T-AC-Lipo, targeting-ligand-modified atorvastatin calcium- and curcumin-loaded liposome; WT, wild type.
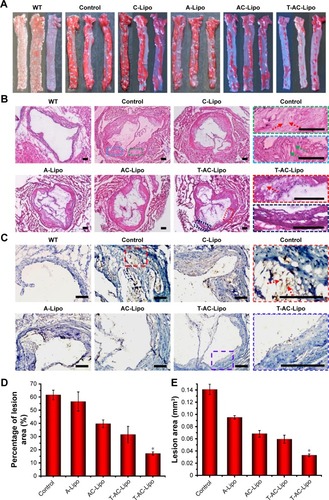
Figure 7 Expression of E-selectin and ICAM-1 proteins in aortic root lesions determined by immunofluorescence analysis.
Notes: Yellow and pink fluorescence represent E-selectin and ICAM-1 proteins, respectively. WT, wild-type mouse (C57BL/6) group. Control group, atherosclerotic mouse model (ApoE knockout mouse, ApoE−/−). Scale bars, 100 µm. Liposome concentration, 45 mg/kg body weight. Cur concentration, 2 mg/kg body weight. Ato concentration for A-Lipo and AC-Lipo treatment groups, 1.8 mg/kg body weight. Ato concentration for the T-AC-Lipo treatment group, 1.4 mg/kg body weight.
Abbreviations: A-Lipo, atorvastatin calcium-loaded liposome; AC-Lipo, atorvastatin calcium- and curcumin-loaded liposome; Ato, atorvastatin calcium; Cur, curcumin; ICAM-1, intercellular cell adhesion molecule-1; T-AC-Lipo, targeting-ligand-modified atorvastatin calcium- and curcumin-loaded liposome.
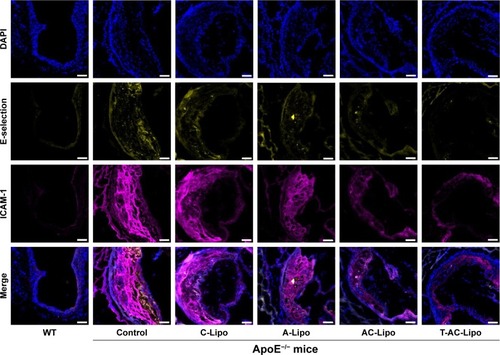
Figure 8 (A) Expression of IL-6 and MCP-1 proteins in aortic root lesions determined by immunofluorescence analysis. Red and green fluorescence represent IL-6 and MCP-1, respectively. WT mice (C57BL/6). Control group and various liposome treatment groups comprised atherosclerotic model (ApoE−/−) mice. Scale bars, 100 µm. Liposome concentration, 45 mg/kg body weight. Cur concentration, 2 mg/kg body weight. Ato concentration for the A-Lipo and AC-Lipo treatment groups, 1.8 mg/kg body weight. Ato concentration for the T-AC-Lipo treatment group, 1.4 mg/kg body weight. (B) Illustration of E-selectin-targeting liposomes (T-AC-Lipo) simultaneously encapsulating Ato and Cur used to treat atherosclerotic ApoE knockout mice.
Abbreviations: Ato, atorvastatin calcium; A-Lipo, atorvastatin calcium-loaded liposome; AC-Lipo, atorvastatin calcium- and curcumin-loaded liposome; Cur, curcumin; MCP-1, monocyte chemotactic protein 1; T-AC-Lipo, targeting-ligand-modified atorvastatin calcium- and curcumin-loaded liposome; WT, wild type.
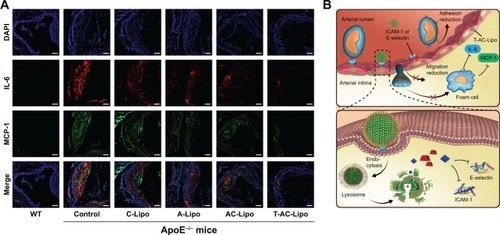
Table 2 Plasma lipids, HMG-CoA reductase concentration, and weight of mice in each group after 30 days therapy with C-Lipo, A-Lipo, AC-Lipo, or T-AC-Lipo
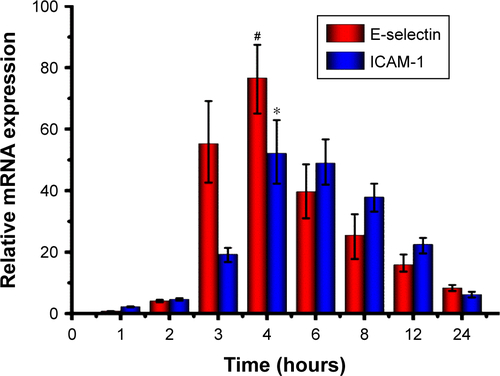
Figure S1 Relative gene expression levels of E-selectin and ICAM-1 in human aortic endothelial cells stimulated with 1 µg/mL lipopolysaccharide for different periods of time (mean ± SD; n=3; *P<0.05 and #P<0.05 compared with that of 2 hours).