Figures & data
Figure 1 The schematic diagram of PHTSm for oncotarget therapy.
Abbreviations: PTX, pacli taxel; TPGS, tocopheryl polyethylene glycol succinate.
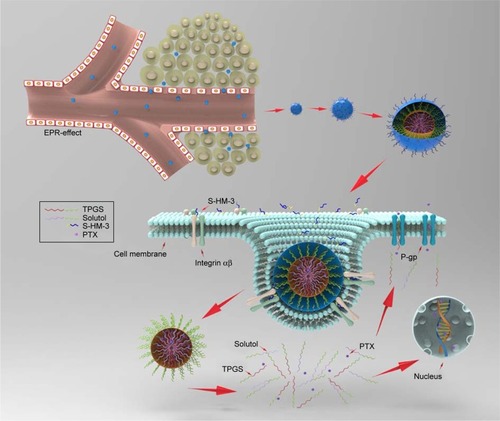
Table 1 The method of dosage regimen (0.2 mL/mouse, caudal vein injection)
Table 2 The amount of PTX feeding for the influence on the particle size, particle size distribution, zeta potential, and encapsulation efficiency of PTSm (n=3)
Table 3 Influence of Solutol and TPGS’s ratio on preparation of PHTSm (n=3)
Figure 2 Characterization of micelles. TEM photo of PTSm (A) and PHTSm (B), and the AFM photo of PHTSm (C). The fluorescence intensity ratio of I1/I3 from pyrene emission spectra vs the log of the concentration (D). The in vitro PTX release profile (E). *P<0.05, **P<0.01.
Abbreviations: AFM, atomic force microscopy; NS, nonsignificant; PTX, paclitaxel; TEM, transmission electron microscopy.
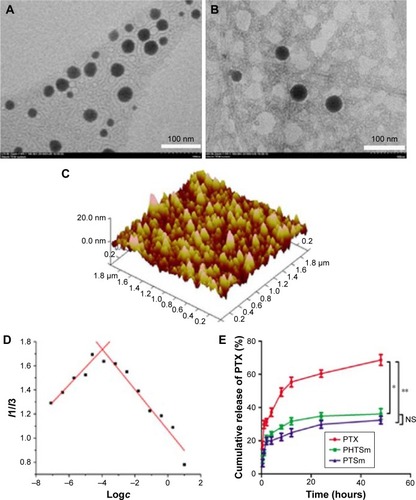
Table 4 IC50 (µg/mL) of different samples (n=3)
Figure 3 The cytotoxicity of micelles on cancer cells.
Notes: The results of MTT tests on A549 (A) and MDA-MB-231 cells (B). Confocal microscopic images of MBA-MB-231 cells after incubation with control, C6-TSm, and C6-HTSm groups for 1 and 3 hours (C). The FACS analysis of MBA-MB-231 cells treated with C6-labeled TSm and HTSm micelles for 1 and 3 hours (D). *P<0.05.
Abbreviations: C6, coumarin-6; FACS, fluorescence-activated cell sorting; PTX, paclitaxel.
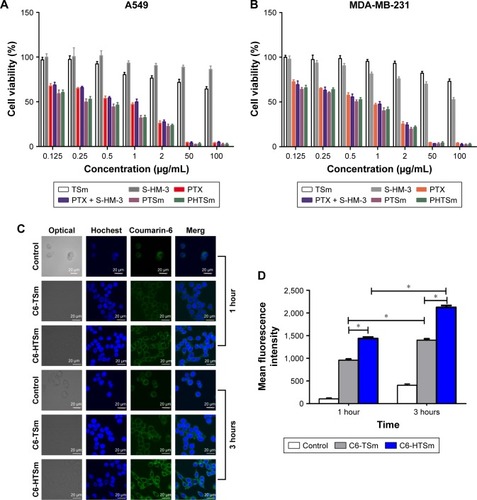
Figure 4 Micelles with S-HM-3 inhibits cell migration.
Notes: The image of different samples on the migration of HUVECs for 24 hours (Scale ×100) (A). Effect on the migration amount of HUVECs (B). Effect on the inhibitor ratio of HUVECs migration (C) (n=3, **P<0.01; ***P<0.001; NS means P>0.05).
Abbreviations: HUVEC, human umbilical vein endothelial cells; NS, nonsignificant.
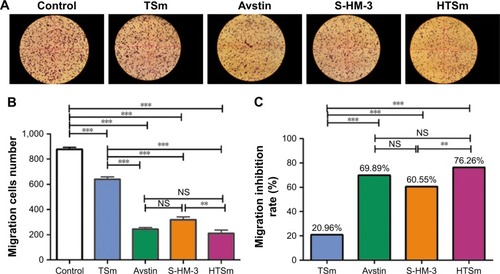
Figure 5 In vivo tumor targeting assays.
Notes: (A) In vivo fluorescence images of different ratios of Solutol and TPGS. (B) Dir-TSm (17:3) and Dir-HTSm (17:3) in MDA-MB-231 tumor-bearing female nude mice.
Abbreviation: TPGS, tocopheryl polyethylene glycol succinate.
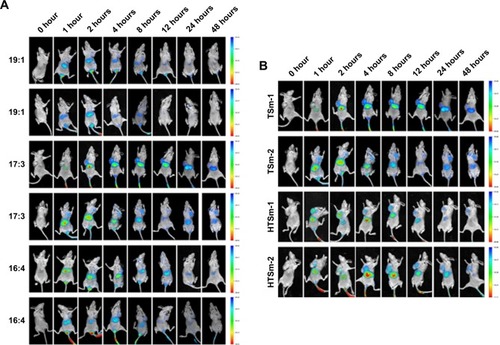
Figure 6 In vivo distribution and pharmacokinetic of free S-HM-3, free PTX and S-HM-3, PTX in PHTSm micelles.
Note: S-HM-3 distributions in different organs after injection (A) S-HM-3 (3.5 mg/kg) and (B) PHTSm (containing S-HM-3 3.5 mg/kg); in vivo S-HM-3 plasma concentration–time curves of (C) free S-HM-3 group and (D) PHTSm group; in vivo PTX plasma concentration–time curve of free PTX (E) and PHTSm (F) after caudal vein administration in SD rat.
Abbreviation: PTX, paclitaxel.
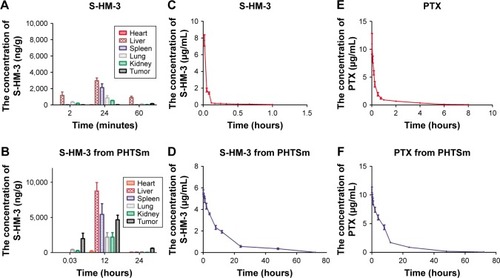
Table 5 S-HM-3 pharmacokinetic parameters of free S-HM-3 group and PHTSm group
Table 6 PTX pharmacokinetic parameters of free PTX group and PHTSm group
Table 7 Tumor weight and tumor inhibition rate of different groups
Figure 7 The results of antitumor assay in vivo.
Notes: Tumor weight (A) and inhibition rate of different groups (B) at 14 days. Tumor volume of different groups (C) and change of tumor weight (D) within 14 days. *P<0.05 means significant difference, **P<0.01 or ***P<0.001 means extremely significant difference.
Abbreviations: NS, nonsignificant; PTX, paclitaxel.
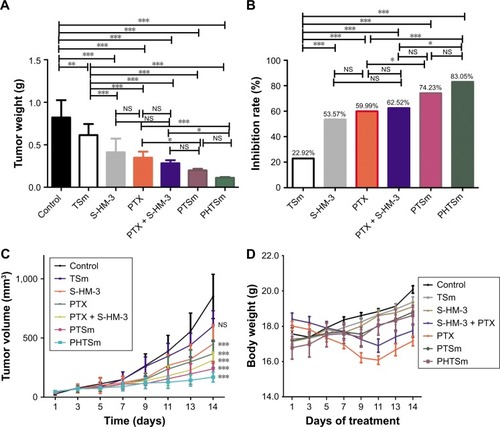
Figure 8 H&E and immunohistochemical micrographs of tumor sections.
Notes: H&E and immunohistochemical micrographs of tumor sections at 14 days (magnification ×400) (A). CD31 (B) and P53 (C) immunohistochemical micrographs of tumor sections at 14 days (n=5). *P<0.05, ***P<0.001.
Abbreviations: MVD, microvessel density; NS, nonsignificant; PTX, paclitaxel.
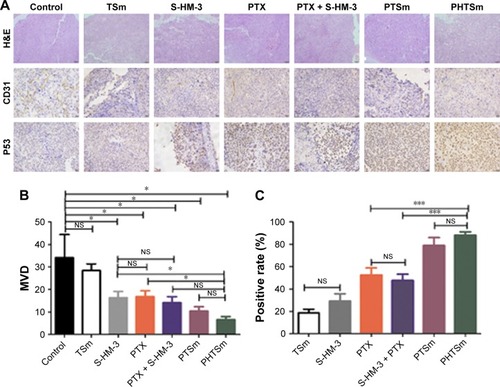
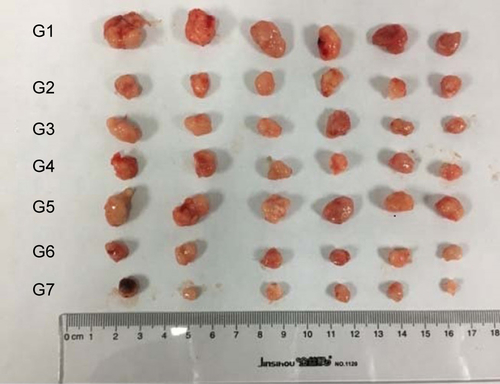
Figure S1 Xenograft tumors harvested at 14 days (G1 of Saline, G2 of PTX + S-HM-3, G3 of S-HM-3, G4 of PTX, G5 of TSm, G6 of PTSm, and G7 of PHTSm).
Abbreviation: PTX, paclitaxel.