Figures & data
Table S1 Blood biochemical test
Table S2 Blood routine test
Figure 1 Preparation of DMC.
Notes: Preparation of DMC and EZH2si complex: first, a novel gene carrier was prepared by a self-assembly method. MPEG-PCL and DOTAP were assembled into a new gene carrier, DOTAP/MPEG-PCL micelles (DMC). Then, EZH2 siRNA was carried into cancer cells by DMC.
Abbreviation: DOTAP, 1,2-dioleoyl-3-trimethylammonium-propane.
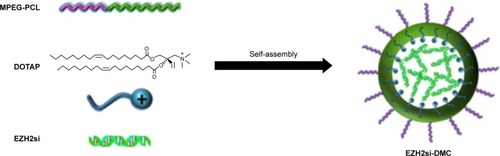
Figure 2 Physicochemical properties of DMC.
Notes: (A) Particle size of DMC; (B) zeta potential of DMC; (C) morphological characteristics of DMC by TEM observation; and (D) gel retardation assay of siRNA and complexes. Lane 1, DNA marker; lane 2, naked siRNA; lanes 3–6, different weight ratios of siRNA with DMC. siRNA was completely incorporated into DMC at a weight ratio of 1:50, and complexes were prepared without free siRNA.
Abbreviation: TEM, transmission electron microscope.
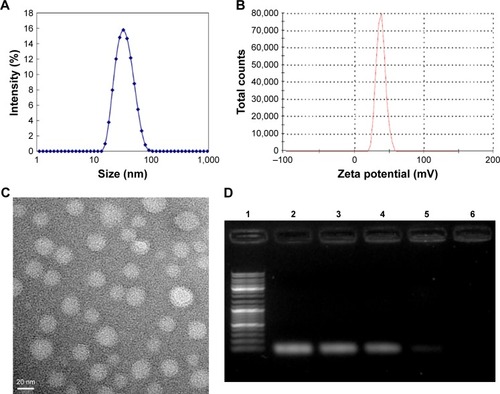
Figure 3 Transfection efficiency measurement of DMC.
Notes: DMC, containing 4 µg siRNA, was used to transfect U87 cells for 4 hours. The transfection efficiencies at both weight ratios (siRNA vs DMC as 1:100 and 1:150) were determined using (A) fluorescence microscope and (B) flow cytometry.
Abbreviation: FITC, fluorescein isothiocyanate.
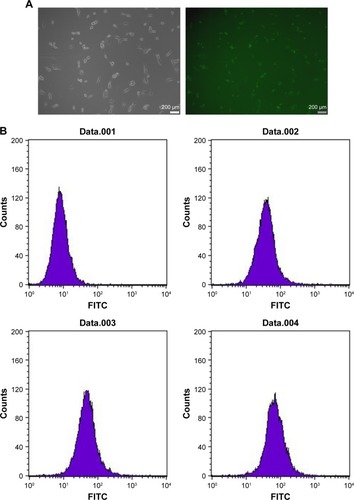
Figure 4 RT-PCR, Western blot and MTT test of cell activity.
Note: When U87 cells were transfected with DMC, Consi-DMC or EZH2si-DMC for 72 hours, EZH2 expression was tested by RT-PCR (A) and Western blot (B), and cell activity was tested by MTT test (C). *P<0.01, EZH2si-DMC versus NS, DMC, Consi-DMC.
Abbreviations: RT-PCR, reverse transcription PCR; NS, normal saline.
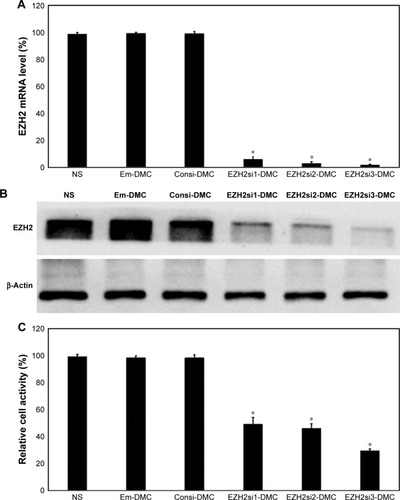
Figure 5 Cell apoptosis test.
Notes: When U87 cells were transfected with DMC (A), Consi-DMC (B) or EZH2si-DMC (C) for 72 hours, U87 cells with different treatments were stained with Annexin V-FITC/PI and tested by flow cytometry. (D) Statistics of tumor cell apoptosis. *P<0.05.
Abbreviations: FITC, fluorescein isothiocyanate; PI, propidium iodide.
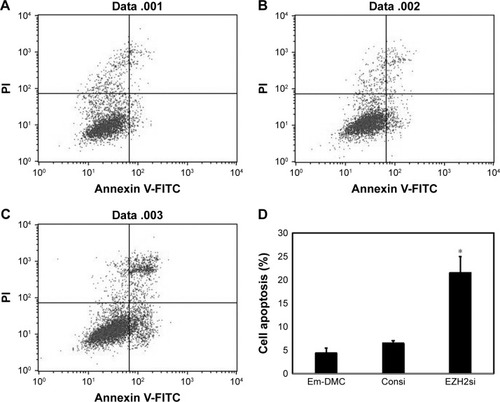
Figure 6 Molecular mechanism of siEZH2-DMC antiglioma.
Notes: (A) The effect of siEZH2-DMC on apoptosis-related proteins by Western blotting analysis. (B) The phosphorylation of Akt and p44/42 MAPK in U87 was inhibited by siEZH2-DMC.
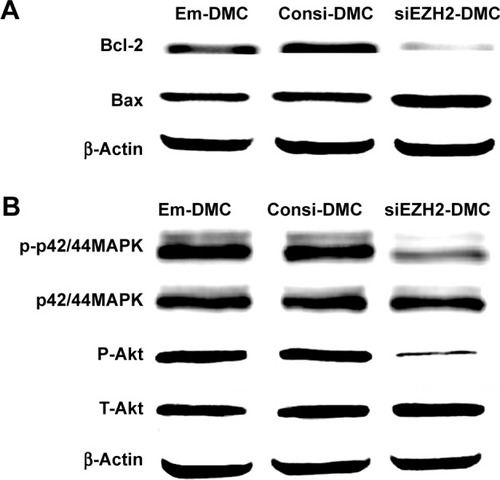
Figure 7 Antiglioma effect of EZH2si-DMC in vivo.
Notes: (A) Tumor growth curves; (B) tumor weight; (C) tumor photos of NS, DMC, DMC-Consi and DMC-EZH2si treatment groups; and (D) body weight of different groups. (Mean ± SEM, n=5) (*P<0.01, DMC-EZH2si vs NS, DMC, DMC-Consi (A); *P<0.01, DMC-EZH2 vs NS, DMC, and DMC-Consi (B).
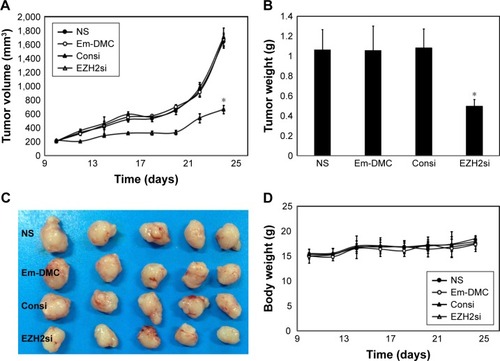
Figure 8 Bioimaging analysis in the GL261 orthotopic mice model.
Notes: (A) Intracerebral glioma was seen by using fluorescence markers. Tumor was inhibited more effectively by α-MM, compared with other groups. (B) Life survival time assessment. Both α-M and α-MM extended life spans of mice, while mice in the α-MM group reached a longer survival time.
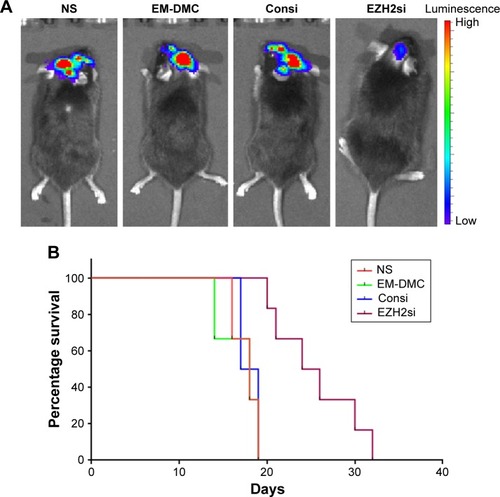
Figure 9 EZH2 expression detection in vivo.
Notes: (A) Intracerebral glioma was seen by using fluorescence markers. Tumor was inhibited more effectively by DMC-EZH2si complex, compared with other groups. (B) Life survival time assessment. DMC-EZH2si complex extended life spans of mice. The EZH2 expression of NS (A), DMC (B) and DMC-Consi (C) were higher than DMC-EZH2si (D). Results indicated that the EZH2 was successfully knocked down by the DMC-EZH2si complex.
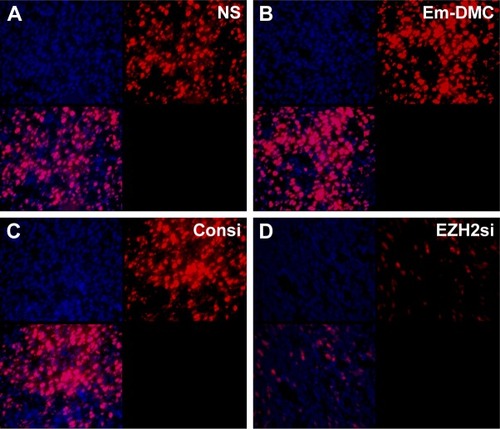
Figure 10 Cell proliferation detection.
Notes: (A) Cell proliferation was assessed by counting the number of Ki67-positive cells in the field (five high power fields per slide). (B) Mean cell proliferation every five fields was added. EZH2si-DMC was superior to other controls in inhibiting cell proliferation. EZH2si-DMC significantly inhibited cell proliferation. *P<0.01, EZH2si-DMC versus NS, DMC, Consi-DMC.
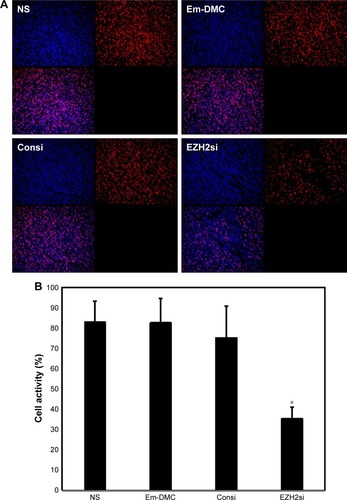
Figure 11 Cell apoptosis detection.
Notes: (A) Cell apoptosis was assessed by counting the number of TUNEL-positive cells in the field (five high power fields per slide), and EZH2si-DMC was superior to other controls in increasing cell apoptosis. (B) Mean apoptosis rate every five fields. EZH2si-DMC significantly increased apoptosis (*P<0.01, EZH2si-DMC vs NS, DMC and Consi-DMC).
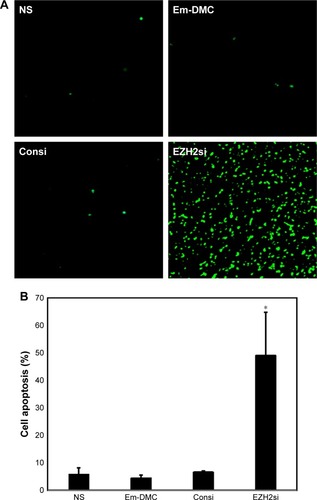
Figure S1 RT-PCR and MTT test of cell activity.
Notes: When GL261 cells were transfected with DMC, Consi-DMC or EZH2si-DMC for 72 hours, EZH2 expression was tested by RT-PCR (A) and cell activity was tested by MTT test (B). (siEZH2-1:GGATACAGCCTGTGCACAT; siEZH2-2:GCTTTGGACAACAAGCCTT; siEZH2-3:GCAAATTCTCGGTGTCAAA).
Abbreviation: RT-PCR, reverse transcription PCR.
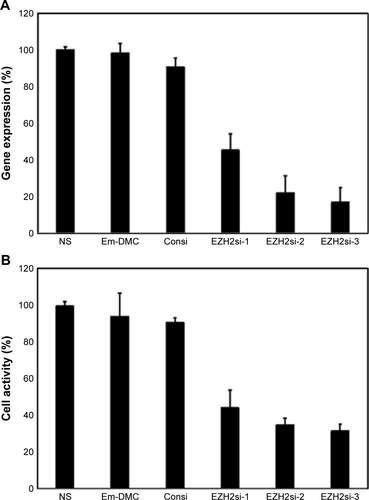
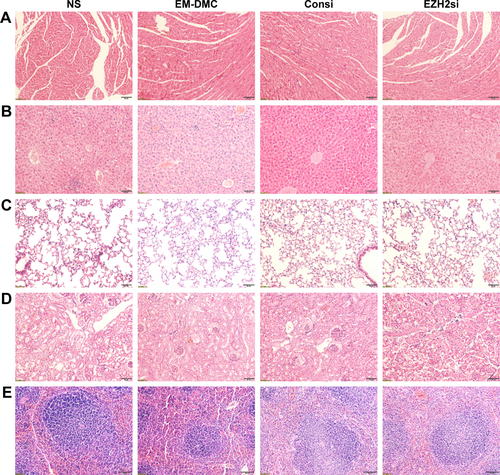
Figure S2 Toxicity assessment in vivo with pathological section.
Notes: Histological examinations of HE-stained (A) heart, (B) liver, (C) lung, (D) kidney, and (E) spleen. No significant pathological changes were detected. Scale bar is 50 µm.