Figures & data
Table S1 Size and cell number of HepG2 spheroids
Figure 1 Physicochemical properties of SiO2 NPs.
Notes: (A) Transmission electron micrographs of SiO2 NPs. (B) Size histogram of SiO2 NPs derived from TEM images. Dispersity (p) is calculated with the formula p = σ/µ, σ = SD; µ = mean value. Primary particle size (dTEM) of SiO2 NPs was calculated as 99.2±2.5 nm (2.5% dispersity). (C) Stability test by analysis of the particle diameter in water (0, 7 days) or culture medium (0, 1, 5, and 7 days). The mean hydrodynamic diameter (dh) from three independent experiments is presented with dispersity (SD). (D) Stability test by leaching analysis. Release of dye molecules from fluorescent SiO2 NPs was determined by fluorescence measurements before and after ultrafiltration through 30 kDa membrane. Fluorescence intensity (%) after 7 days was measured in water and culture medium. (E) Hydrodynamic diameter and zeta potential of SiO2 NPs in water and culture medium (RPMI-1640 supplemented with 10% FBS). dh was determined by calculating the volume distribution.
Abbreviations: NP, nanoparticle; TEM, transmission electron microscopy.
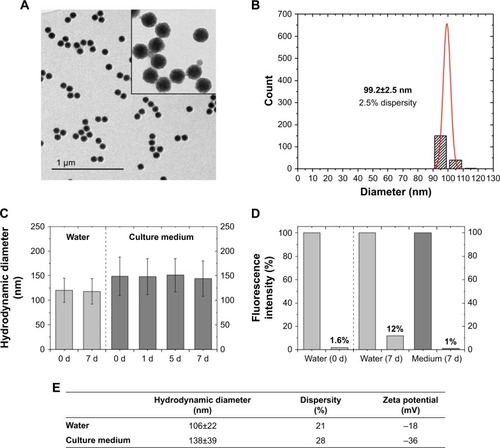
Figure 2 Spheroid morphology during formation.
Notes: The development of HepG2 spheroids was studied over time. After seeding of 1,000 HepG2 cells per well, images of spheroids were taken using bright-field microscopy at different days (day 1, 2, 4, and 7) after cell seeding. Scale bar indicates 100 µm.
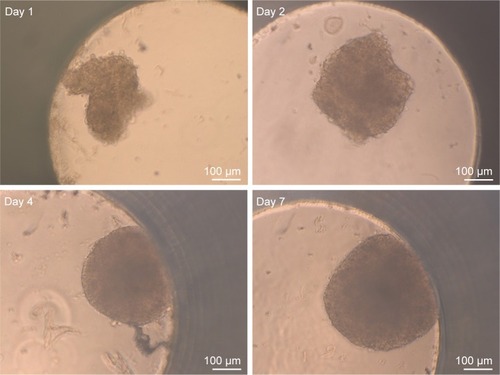
Figure 3 Morphology of HepG2 spheroids.
Notes: (A) Formation of bile canaliculi in HepG2 spheroids. Spheroids were stained for bile canaliculi at day 7 after cell seeding and analyzed by lightsheet microscopy. A maximum intensity projection was generated from a z-stack of representative spheroid. (B) CLS images of HepG2 spheroids. For imaging, spheroids were fixed, cut into 10-µm-thick cryoslices and stained for nucleus (yellow), actin cytoskeleton (green), and MRP-2 (gray), which is expressed in the canalicular membrane. One representative image of spheroid is shown. Red box indicates the detailed image position. A detailed image is shown on the right. Arrows indicate the localization of MRP2 (gray) in the micrograph.
Abbreviations: CLS, confocal laser scanning microscopy; MRP-2, multidrug resistance-associated protein2.
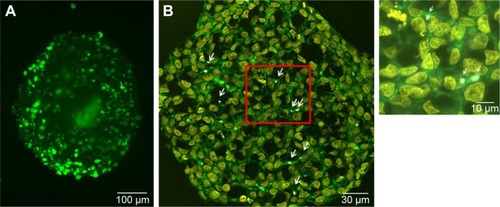
Figure 4 Cell viability of HepG2 spheroids.
Notes: Spheroids were stained with FDA (green) as viable marker and PI (red) as necrosis marker. Representative images of untreated cell spheroid (A), spheroid exposed to 100 µg mL−1 SiO2 NPs for 24 hours (B), and spheroid exposed to 1% triton X-100 for 1 hour (C) are shown. Beside the transmission image, the fluorescence images of the FDA and PI as well as the merged image of all channels are presented.
Abbreviations: FDA, fluorescein diacetate; NPs, nanoparticles; PI, propidium iodide.
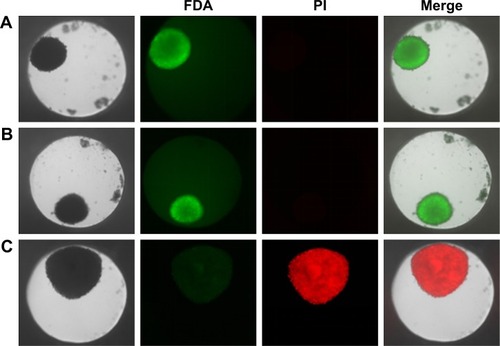
Figure 5 Oxidative stress level of HepG2 spheroids.
Notes: Cellular oxidative stress of HepG2 spheroids was determined after exposure to varying concentrations of SiO2 NPs. Menadione was used as the positive control. Results are presented as mean ± SD from two independent experiments. Dashed line indicates control value (100%).
Abbreviation: NPs, nanoparticles.
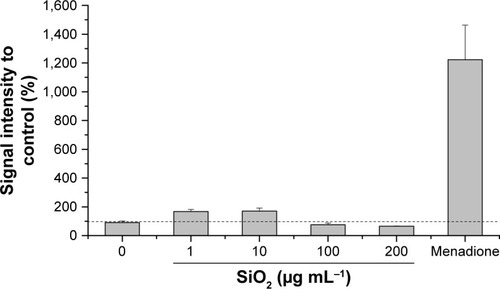
Figure 6 Distribution of SiO2 NPs in HepG2 spheroids after spheroid formation.
Notes: 100 µg mL−1 SiO2 NPs were applied 7 days after seeding for 24 hours. For imaging, spheroids were fixed and cut into 10-µm-thick cryoslices. Three independent experiments were performed. Representative images of the samples are shown. (A) CLS images of the spheroids. After preparation of cryoslices, samples were stained for CLS microscopy. The cell nucleus (yellow), cytoskeleton (green), and SiO2 NPs (magenta) are imaged. Red box indicates the detailed image position, which is derived from a maximum projection, shown on the right. (B) Back-scattered electron micrographs of the whole spheroid (left) and a detailed image (right) are shown. Red box indicates the detailed image position.
Abbreviations: CLS, confocal laser scanning microscopy; NPs, nanoparticles.
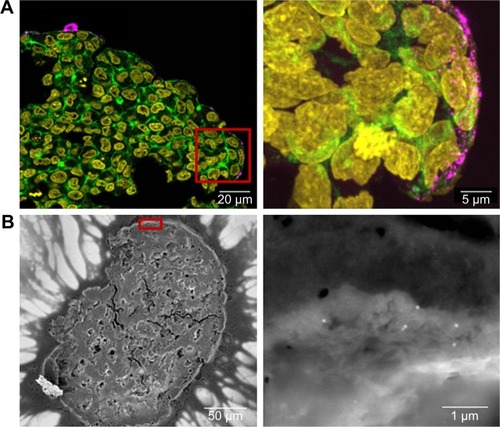
Figure 7 Distribution of SiO2 NPs in HepG2 spheroids added at the beginning of spheroid formation.
Notes: 100 µg mL−1 SiO2 NPs were applied at seeding day 0 for 7 days. For imaging, spheroids were fixed and cut into 10-µm-thick cryoslices. Representative images of the samples are shown. (A) CLS images of the spheroids. After preparation of cryoslices, samples were stained for CLS microscopy. The cell nucleus (yellow), cytoskeleton (green), and SiO2 NPs (magenta) are imaged. Red box indicates the detailed image position, which is derived from a maximum projection, shown on the right. (B, C) Backscattered electron micrographs of a spheroid overview (left) and a detailed image (right) are shown. Red box indicates the detailed image position. Arrows highlight the localization of SiO2 NPs in the spheroid.
Abbreviations: CLS, confocal laser scanning microscopy; NPs, nanoparticles.
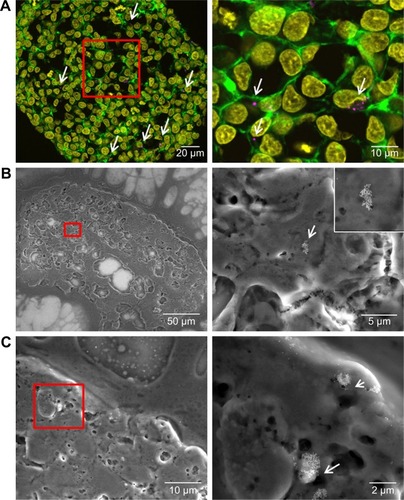
Figure 8 Distribution of SiO2 NPs in HepG2 spheroids during spheroid formation.
Notes: 100 µg mL−1 SiO2 NPs were applied at day 2 after seeding for 5 days. For imaging, spheroids were fixed and cut into 10-µm-thick cryoslices. Representative images of the samples are shown. (A) CLS images of the spheroids. After the preparation of cryoslices, samples were stained for CLS microscopy. The cell nucleus (yellow), cytoskeleton (green), and SiO2 NPs (magenta) are imaged. Red box indicates the detailed image position, which is derived from a maximum projection, shown on the right. (B) Back-scattered electron micrographs of a spheroid overview (left) and a detailed image (right) are shown. Red box indicates the detailed image position on the right.
Abbreviations: CLS, confocal laser scanning microscopy; NPs, nanoparticles.
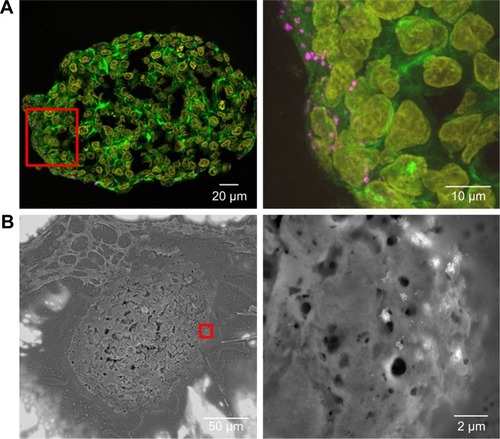
Figure S1 Packing density of HepG2 spheroids at day 3 and 7.
Notes: Several HepG2 spheroids were analyzed at day 3 (left) or day 7 (right) after seeding of 1,000 cells per well. In representative confocal fluorescence micrographs the cell membrane (green) and cell nucleus (cyan) are presented. Exemplarily overview images of the whole spheroids are shown.
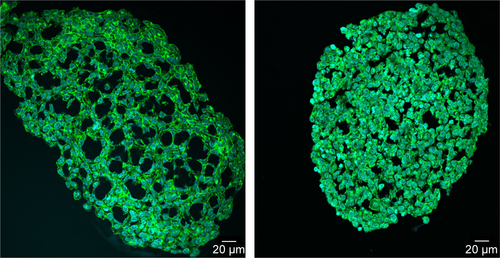
Figure S2 Cell viability of HepG2 spheroids in the presence of SiO2 NPs.
Notes: After their formation, HepG2 spheroids were incubated with varying SiO2 NP concentrations (1, 10, 100, 200 µg mL−1) for 24 hours. Cell viability was determined by Resazurin assay. Results are presented as mean ± SD from three independent experiments. Dashed line indicates control value (100%).
Abbreviation: NPs, nanoparticles.
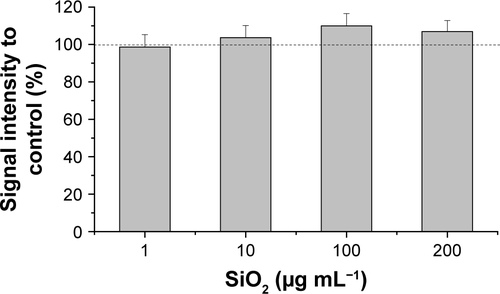
Figure S3 Immunostaining of whole HepG2 spheroid.
Notes: Prior to staining, HepG2 spheroid was permeabilized with triton X-100 for 30 minutes at room temperature. After blocking with 5% BSA, the sample was immunostained for nuclear lamina (Lamin B). Embedding of the spheroid under a cover slide resulted in a flattened form. Confocal image of HepG2 spheroid immunostained for nuclear lamina is depicted in yellow. Orthogonal views (xy, xz, and yz) showing the intersection planes at the position of the green cross-hair.
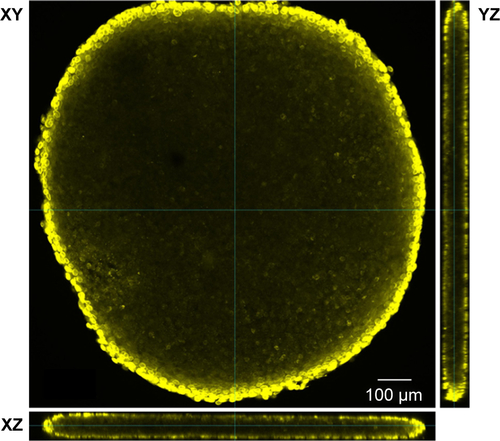
Figure S4 Nanoparticle localization in spheroids.
Notes: HepG2 spheroids were exposed to 100 µg mL−1 SiO2 NPs either after spheroid formation (A) or during spheroid formation at day 0 (B) or day 2 (C). In representative confocal fluorescence micrographs, the cell membrane (green) and SiO2 NPs (magenta) are presented. Overview images of the whole spheroid (left) are shown. White frame indicates the position of the detailed z-stacks. Exemplary, orthogonal views (xy, xz, yz) were derived from z-stacks at a selected layer. Arrows highlight the localization of SiO2 NPs in the spheroid.
Abbreviation: NPs, nanoparticles.
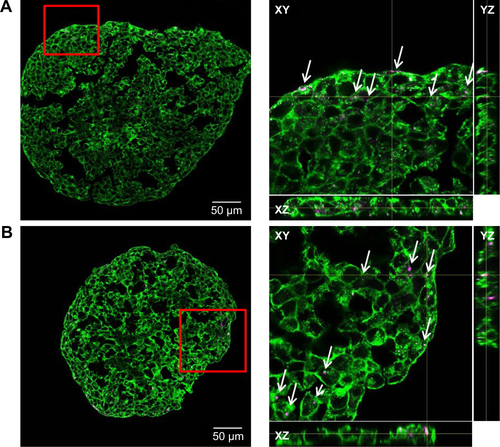
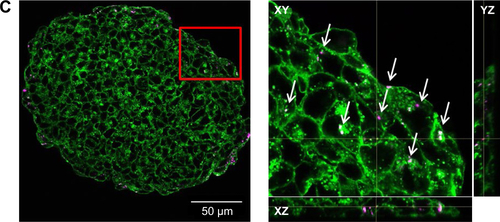
Figure S5 Localization of ATTO 647N-APTES dye conjugate in spheroids.
Notes: HepG2 spheroids were exposed to 0.83 µM ATTO 647N-APTES dye conjugate after spheroid formation (A) or during spheroid formation at day 0 (B). In representative confocal fluorescence micrographs, the actin cytoskeleton (green, left) or ATTO 647N-APTES dye conjugate (magenta, right) are presented.
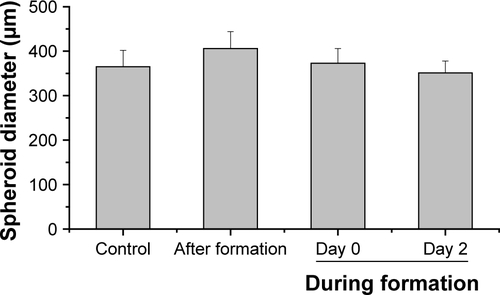
Figure S6 Spheroid diameter in dependence of the silica nanoparticle exposure scenario.
Notes: HepG2 spheroids were either untreated or exposed to 100 µg mL−1 SiO2 NPs either after spheroid formation or during spheroid formation (day 0, day 2). Spheroid diameter was determined for five spheroids (n=5). Results are presented as mean + SD.
Abbreviation: NPs, nanoparticles.