Figures & data
Figure 1 1H-NMR of dextran-cinnamaldehyde acetal conjugates.
Note: 1H-NMR spectrum of dextran-cinnamaldehyde acetal conjugates at normal pH (7.4) and at acidic pH (6.5) in DMSO-d6, aldehyde protons were observed at 9.5 ppm.
Abbreviations: CA, cinnamaldehyde; Dex, dextran; 1H-NMR, proton nuclear magnetic resonance.
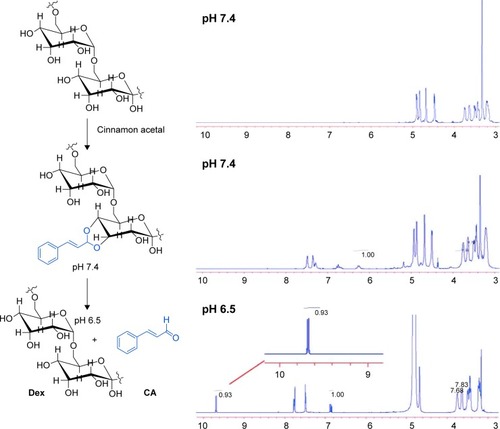
Figure 2 Characteristics of the nanoparticles.
Notes: (A) A representative transmission electron microscopy (TEM) image and dynamic light scattering (DLS) analysis of nanoparticles in phosphate buffer (pH 7.4). Dh ~182.3 nm, polydispersity index ~0.225, ζ ~-3.86 mV. (B) The critical micelle concentration of nanoparticles. (C, D) DLS profiles of nanoparticles recorded at different pH values. (E) Release kinetics of 10-hydroxy camptothecin (HCPT) from HCPT-CA-loaded nanoparticles (PCH) at pH 7.4 and 5.0. (F) Release kinetics of cinnamaldehyde (CA) from PCH at pH 7.4 and 5.0. Data presented as mean ± SD (n=3).
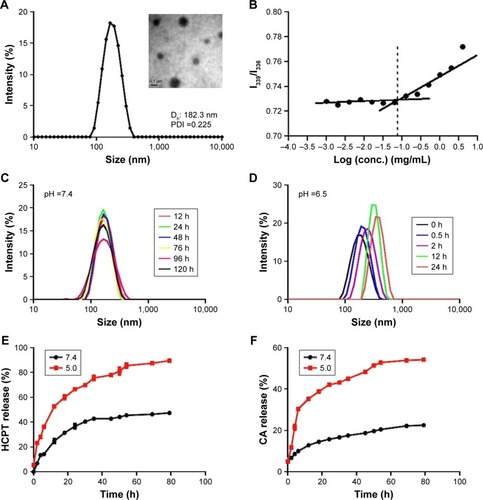
Figure 3 Endocytosis of ICG-loaded nanoparticles by HCT116 cells at different pH values.
Notes: (A) Cellular localization of ICG after 2 hours incubation with ICG-loaded nanoparticles at different pH values, separately. The fluorescence of Hoechst 33342 is blue; the fluorescence of ICG is red. (B) Flow cytometric analysis of HCT116 cells’ endocytosis incubated with ICG-loaded nanoparticles for 2 hours. (C) Geometric mean fluorescence of HCT116 cells after incubation at different pH values, for different time periods. *P<0.05, compared with the corresponding Con group (n=3).
Abbreviations: CA, cinnamaldehyde; Con, Control; HCPT, 10-hydroxy camptothecin; ICG, indocyanine green; PCH, HCPT-CA-loaded nanoparticles.
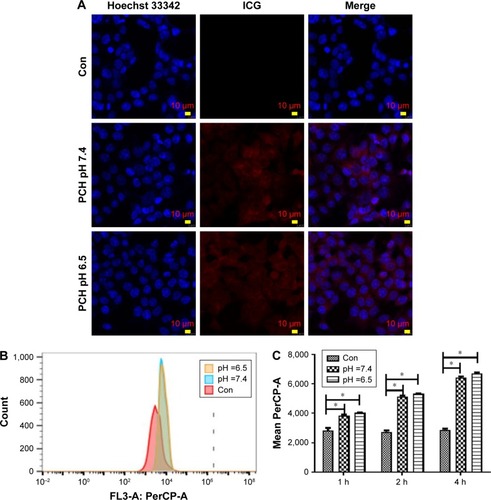
Figure 4 The effect of PCH on the viability, proliferation, and migration of colon cells.
Notes: (A) Normal BEAS-2B cells’ survival rate determined by MTT assay. (B) Cardiomyocytes 4910 cell survival rate determined by MTT assay. (C) Human saphenous vein endothelial cell HUVEC survival rate determined by MTT assay. (D) Colon cancer cell HCT116 survival rate determined by MTT assay. ***P<0.001, ****P<0.0001, compared with DMSO (n=3). (E) The results of HCT116 cell scratch experiments. (F) The results of colony formation assay, quantitative data are shown in Figure S1. (PCH equivalent to 10 µg/mL HCPT).
Abbreviations: CA, cinnamaldehyde; Con, control; HCPT, 10-hydroxy camptothecin; PCH, HCPT-CA-loaded nanoparticles.
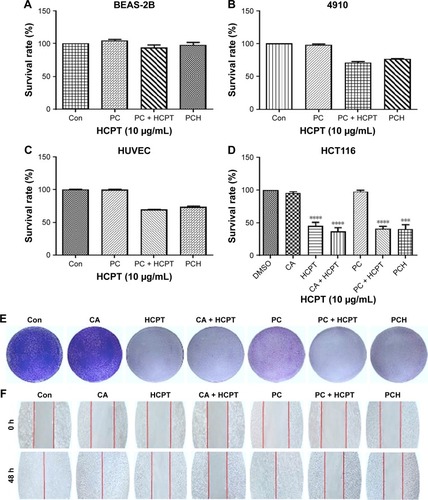
Figure 5 PCH-induced apoptosis in HCT116 colon cancer cells.
Notes: (A) HCT116 cells were pre-incubated with or without 5 mM NAC for 0.5 hour before exposure to PCH at the indicated concentrations for 12 hours. The percentage of cell apoptosis was determined by Annexin-V/PI staining and flow cytometry. (B) The percentage of apoptotic cells in the treatment groups was calculated. **P<0.01; ***P<0.001, compared with the Con group (n=3). (C) The colon cancer cell lines were pre-incubated with or without 5 mM NAC for 0.5 hour before exposure to PCH at indicated concentrations for 24 hours, the expression of apoptosis-related proteins was determined by Western blot analysis. GAPDH was used as loading control. All data are expressed as mean ± SE of triplicate experiments. All images shown are representative of three independent experiments with similar results. Error bars represent the SEM of triplicates. (D) Effect of PCH on the morphology of mitochondria in HCT116 cells. HCT116 cells were treated as described in the “Materials and methods” section. The morphology of mitochondria in HCT116 cells was examined with a transmission electron microscope (×10,000 or ×50,000). Results from a representative cell sample out of three studied in each group are shown. The shape of the mitochondria is normal in the control group cells, the PCH + NAC (5 mM) group cells, and NAC (5 mM) group cells (arrows indicate normal mitochondria). Exposure to PCH for 6 hours caused mitochondrial dysfunction in the PCH group cells (arrows indicate swollen mitochondria). (PCH equivalent to 10 µg/mL HCPT).
Abbreviations: Annexin V-FITC, annexin fluorescein isothiocyanate-labeled annexin V; CA, cinnamaldehyde; Con, control; HCPT, 10-hydroxy camptothecin; NAC, N-acetyl-cysteine; PCH, HCPT-CA-loaded nanoparticles; PI, propidium iodide; SE, standard error.
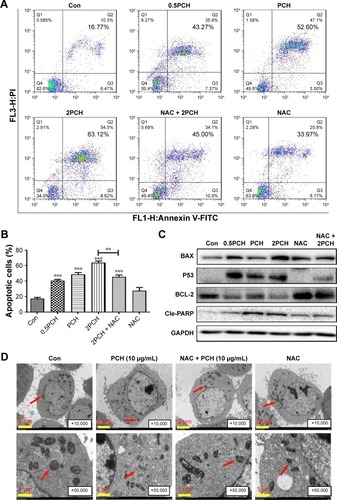
Figure 6 PCH increased the ROS level and induced the expression of mitochondrial and ER-stress-related proteins.
Notes: (A) ROS generation in HCT116 cells treated with 100 mM of CA, HCPT or PCH by flow cytometric analysis. *P<0.05; **P<0.01, ***P<0.001 compared with DMSO (n=3). HCT116 cells were pre-incubated with or without 5 mM NAC for 0.5 hour before exposure to PCH. Then, intracellular ROS generation was measured by flow cytometric analysis. (B) HCT116 cells were treated with PCH for the indicated times, the protein levels of ATF4, p-elf2α, and CHOP were determined by Western blot analysis. GAPDH and elf2α were used as internal control. (C) HCT116 cells were pre-incubated with or without 5 mM NAC for 0.5 hour before exposure to PCH at the indicated concentrations, then ATF4, p-elf2α, and CHOP expressions were detected by Western blot analysis. GAPDH and elf2α were used as internal control. (D) Effect of PCH on the morphology of ER in HCT116 cells. HCT116 cells were treated as previously described. The morphology of the ER in HCT116 cells was examined using a transmission electron microscope (×10,000 or ×50,000). The results from a representative cell sample out of three studied in each group are shown. The ER morphology is normal in the control group, the PCH + NAC (5 mM) group, and NAC (5 mM) group (arrows indicate normal ER). Exposure to PCH for 6 hours caused mitochondrial dysfunction in PCH group (arrows indicate swollen ER). (PCH equivalent to 10 µg/mL HCPT).
Abbreviations: CA, cinnamaldehyde; Con, ; ER, endoplasmic reticulum; HCPT, 10-hydroxy camptothecin; NAC, N-acetyl-cysteine; PCH, HCPT-CA-loaded nanoparticles.
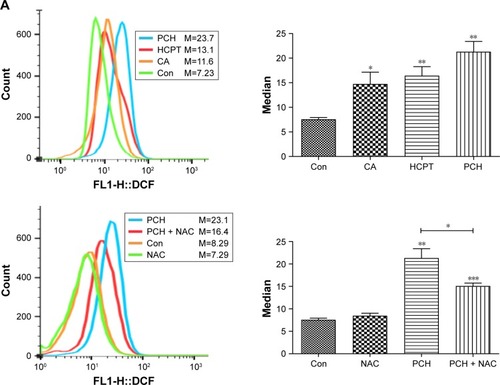
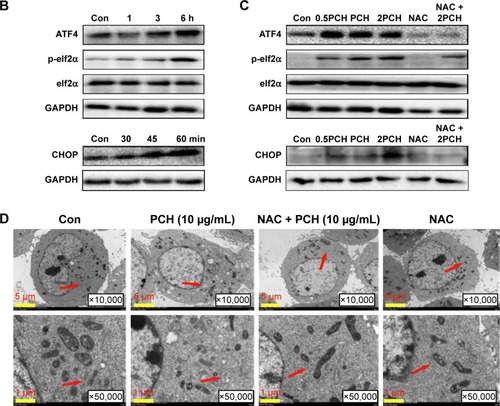
Figure 7 The pharmacokinetic parameters and bio-distribution of PCH nanoparticles in vivo.
Notes: Sprague Dawley rats were intravenously injected with PCH (equivalent to 5 mg/kg HCPT) or free HCPT (5 mg/kg). (A) Blood samples (200 µL) were collected at appropriate intervals after administration (n=5) at each time point and the plasma HCPT concentration was analyzed by high performance liquid chromatography. (B) Pharmacokinetic parameters of HCPT and PCH micelles. Data show mean ± SE (n=5). Tumor-bearing BALB/cA nu/nu female mice were intravenously injected with free ICG (2 mg/kg) or ICG-loaded PCH nanoparticles (PCH/ICG). (C) The biodistribution of ICG recorded by an in vivo imaging system at 6 hours, 24 hours, and 48 hours. Red circles: tumor sites (n=6). (D) The bio-distribution of ICG in major organs and tumor tissues at 24 hours.
Abbreviations: CA, cinnamaldehyde; HCPT, 10-hydroxy camptothecin; ICG, indocyanine green; PCH, HCPT-CA-loaded nanoparticles; SE, standard error.
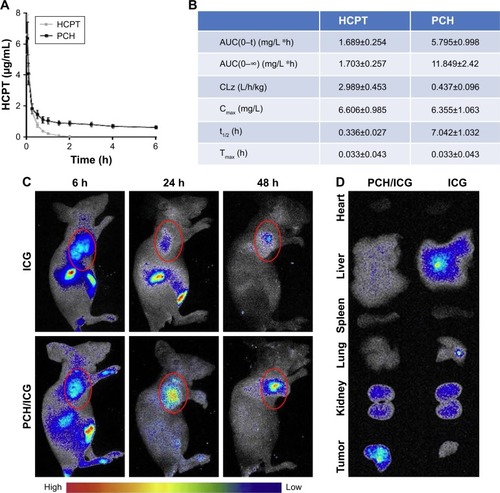
Figure 8 In vivo anticancer effects of PCH.
Notes: HCT116 tumor-bearing nude mice (tumor volume >100 mm3) were randomly divided into four groups (six/group) and intravenously injected with saline, free HCPT (5 mg/kg), HCPT and CA, and PCH alone every 3 days, five times. The tumor volume (A) and body weight (B) were monitored every 2 days. The experiment was repeated three times. Bars shown are mean ± SE. (C) Images of tumor-bearing mice treated with various formulations. (D) Weight of tumor-bearing mice treated with various formulations. **P<0.01, ***P<0.001 compared with Con group (n=6).
Abbreviations: CA, cinnamaldehyde; Con, control; HCPT, 10-hydroxy camptothecin; PCH, HCPT-CA-loaded nanoparticles.
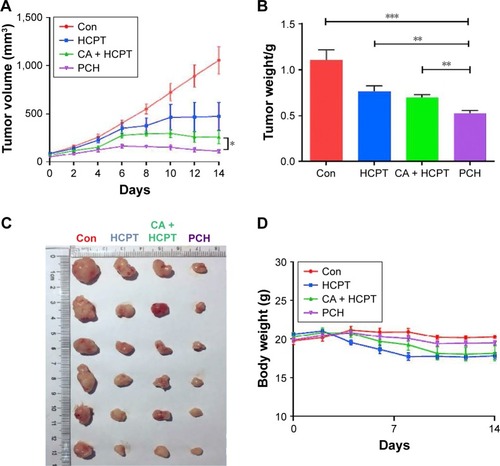
Figure 9 H&E images and Western blot analysis of tumor tissue lysates.
Notes: (A) Kidney, liver, and heart tissue from four groups of mice were sectioned (5 µm) and the slides were stained with H&E, (n=3 in each group). All images were obtained with a microscope with 20× magnification (scale bar, 50 µm) or 40× magnification (scale bar, 100 µm). PCH administration did not cause histological abnormalities in kidneys, livers, and hearts. Green arrows indicate structural disturbance in areas of the kidney. (B) Western blot analysis of the expression of mitochondrial pathway-related and ER-stress-related proteins from respective tumor tissue lysates. GAPDH was used as protein loading control.
Abbreviations: CA, cinnamaldehyde; Con, control; ER, endoplasmic reticulum; HCPT, 10-hydroxy camptothecin; PCH, HCPT-CA-loaded nanoparticles.
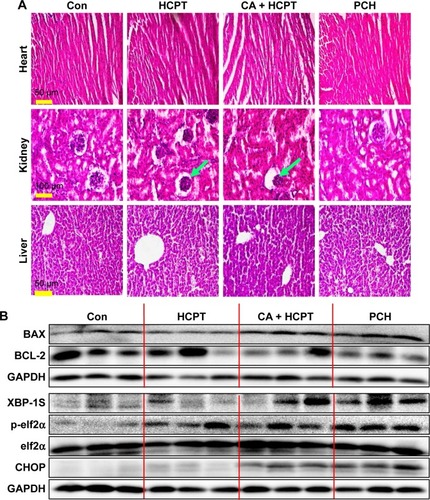
Figure 10 Schematic illustration of the underlying mechanism of the anticancer activity of PCH.
Abbreviations: CA, cinnamaldehyde; HCPT, 10-hydroxy camptothecin; PCH, HCPT-CA-loaded nanoparticles.
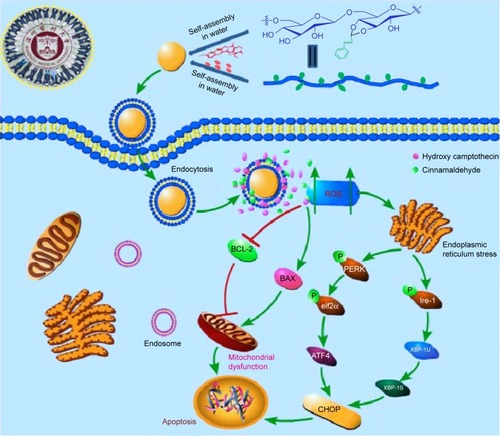
Figure S1 Quantitative data of cancer cells’ migration of .
Notes: ***P<0.001.
Abbreviations: CA, cinnamaldehyde; Con, control; HCPT, 10-hydroxy camptothecin; PCH, HCPT-CA-loaded nanoparticles.
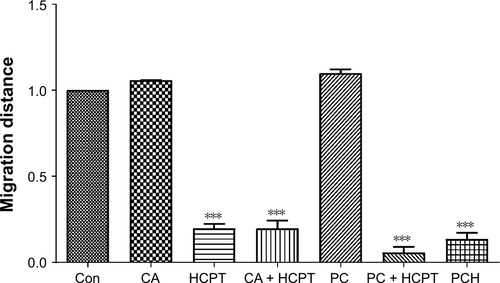
Figure S2 Quantitative data of .
Notes: HCT116 cells were pre-incubated with or without 5 mM NAC for 0.5 hour before exposure to PCH at the indicated concentrations, then the expressions of apoptosis-related proteins (A) BAX, (B) P53, (C) BCL-2, and (D) Cle-PARP were detected by Western blot analysis. *P<0.05; **P<0.01.
Abbreviations: CA, cinnamaldehyde; HCPT, 10-hydroxy camptothecin; NAC, N-acetyl-cysteine; PCH, HCPT-CA-loaded nanoparticles.
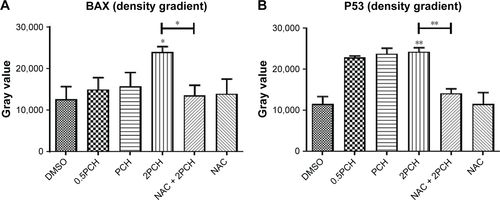
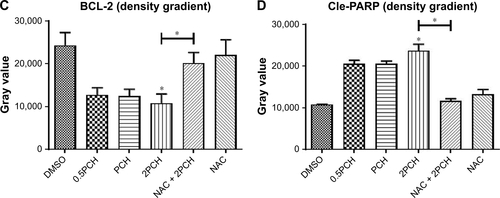
Figure S3 Quantitative data of .
Notes: HCT116 cells were treated with PCH for the indicated times, the protein levels of (A) ATF4, (B) CHOP, (C) elf2α, and (D) p-elf2α were determined by Western blot analysis. *P<0.05, **P<0.01, ***P<0.001.
Abbreviations: Con, control; ER, endoplasmic reticulum.
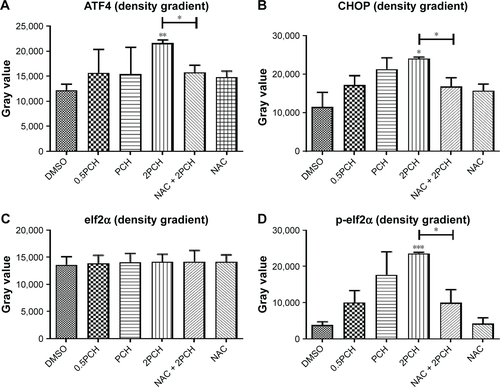
Figure S4 Quantitative data of .
Notes: HCT116 cells were pre-incubated with or without 5 mM NAC for 0.5 hour before exposure to PCH at the indicated concentrations, then (A) ATF4, (B)CHOP, (C) elf2α and (D) p-elf2α expressions were detected by Western blot analysis.*P<0.05, **P<0.01, ***P<0.001.
Abbreviations: CA, cinnamaldehyde; ER, endoplasmic reticulum; HCPT, 10-hydroxy camptothecin; NAC, N-acetyl-cysteine; PCH, HCPT-CA-loaded nanoparticles.
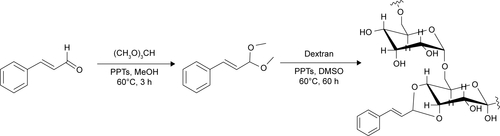
Scheme S1 A synthetic route of pH-responsive dextran cinnamaldehyde acetal copolymers.