Figures & data
Table 1 Nanoparticle properties of unloaded LPNs and P-LPNs
Figure 1 Physicochemical characterization of the P-LPNs.
Notes: (A) Particle size distribution of P-LPNs was measured by dynamic light scattering spectroscopy. (B) TEM imaging of the P-LPNs. (C) In vitro drug release profiles of free PSO and P-LPNs in PBS (0.01 M, pH 7.4) containing 0.5% (w/v) Tween-80.
Abbreviations: P-LPN, PSO-loaded lipid-polymer hybrid nanoparticle; PSO, psoralen; TEM, transmission electron microscopy.
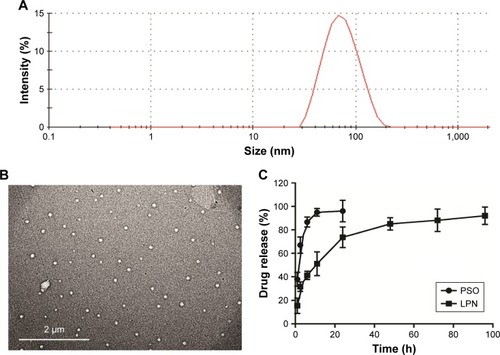
Figure 2 Cytotoxicity of drug and nanoparticle combinations.
Note: (A) Cell viability in vitro on HepG2/ADR cells at a PSO equivalent concentration ranging from 2.5 to 40 µM. (B) Cytotoxicity of DOX, DOX+PSO, and DOX+P-LPNs on HepG2/S cells. (C) Cytotoxicity of DOX+PSO and DOX+P-LPNs on HepG2/ADR cells in comparison with free DOX. Percent survival was compared to that of untreated controls and expressed as a percentage of these controls. (D and E) Apoptosis assay of HepG2/ADR cells after incubation with DOX, DOX+PSO, and DOX+P-LPNs over 24 hours. (F and G) Apoptosis assay of HepG2/ADR after incubation with DOX, DOX+PSO, and DOX+ P-LPNs over 48 hours.*P<0.05, **P<0.01, ***P<0.001.
Abbreviations: DOX, doxorubicin; LPN, lipid-polymer hybrid nanoparticle; P-LPN, PSO-loaded lipid-polymer hybrid nanoparticle; PSO, psoralen.
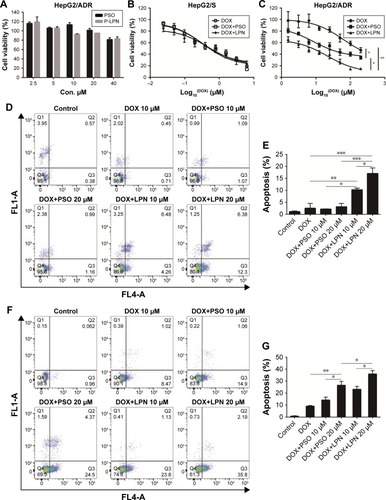
Figure 3 Cellular uptake of DOX and cell cycle distribution measured by flow cytometry.
Note: (A and B) Cellular uptake of free DOX, DOX+PSO, DOX+P-LPNs, and DOX+Verapamil in HepG2/ADR cells. DOX+Verapamil vs DOX. (C and D) Cell cycle distribution of HepG2/ADR cells measured by flow cytometry, after being treated with formulations of DOX, DOX+PSO, and DOX+P-LPNs for 48 hours. ****P<0.0001.
Abbreviations: DOX, doxorubicin; LPN, lipid-polymer hybrid nanoparticle; P-LPN, PSO-loaded- lipid-polymer hybrid nanoparticle; PSO, psoralen.
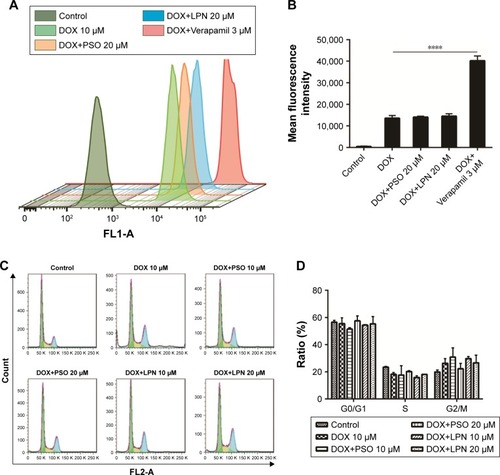
Figure 4 Drug and nanoparticle effects on ROS and mitochondrial potential.
Note: (A) ROS content of HepG2 cells measured by flow cytometry, after treatment with formulations of DOX, DOX+PSO, and DOX+P-LPNs for 48 hours. HS was referred to HepG2/S cell. (B) The ROS content ensuing from different treatments are presented as mean fluorescence intensity values. (C) The mitochondrial membrane potential in HepG2/ ADR cells was determined by the JC-1 dye after incubation with various formulations of DOX, DOX+PSO, and DOX+P-LPNs for 48 hours. (D) The mitochondrial membrane potential is expressed as the fluorescence ratios 488/570 and 488/525 nm (aggregates to monomer). *P<0.05, **P<0.01, ***P<0.001, ****P<0.0001.
Abbreviations: DOX, doxorubicin; LPN, lipid-polymer hybrid nanoparticle; P-LPN, PSO-loaded lipid-polymer hybrid nanoparticle; PSO, psoralen.
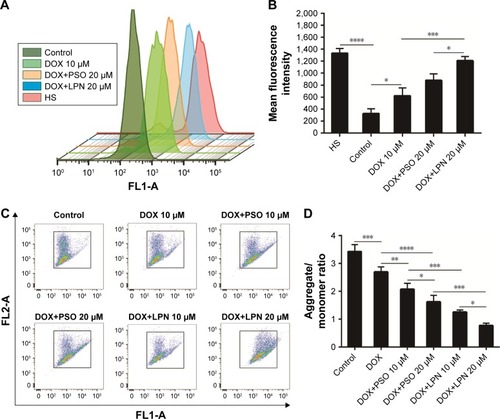
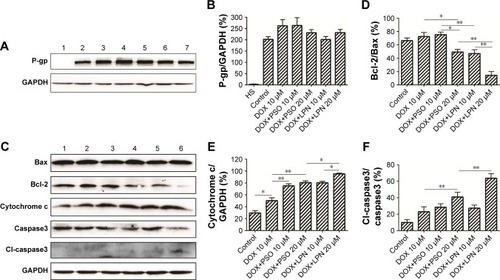
Figure 5 Western blotting analysis of P-glycoprotein and apoptotic proteins.
Note: (A) The expression of P-gp was detected by Western blotting. Lane 1 represents HepG2/S cells without treatment, lanes 2, 3, 4, 5, 6, and 7 represent the untreated control, free DOX (10 µM), DOX+PSO (10 µM), DOXµPSO (20 µM), DOX+LPNs (10 µM), DOX+LPNs (20 µM) treated HepG2/ADR cell. (B) Relative content of P-gp compared to GAPDH. (C) Relative content of Bcl-2/Bax. (D) The expression of Bcl-2/Bax, cytochrome c, and caspase3 (total and cleaved) was detected by Western blotting. Lanes 1, 2, 3, 4, 5, and 6 represent the untreated control, free DOX (10 µM), DOX+PSO (10 µM), DOX+PSO (20 µM), DOX+LPNs (10 µM), DOX+LPNs (20 µM) treated HepG2/ADRcell. (E) Relative content of cytochrome c/GAPDH. (F) Relative content of cl-caspase3/caspase3. *P<0.05, **P<0.01.
Abbreviations: DOX, doxorubicin; LPN, lipid-polymer hybrid nanoparticle; P-gp, P-glycoprotein; PSO, psoralen.