Figures & data
Figure 1 (A) Synthesis route of mPEG-PLGA diblock copolymer and schematic diagram of preparation of IDA/mPEG-PLGA NPs. (B) 1H NMR characterization of mPEG-PLGA diblock copolymers. (C) FTIR spectra of three kinds of mPEG-PLGA diblock copolymers.
Abbreviations: GA, glycolide; IDA, idarubicin; LLA, l-lactide; mPEG, methoxy poly(ethylene glycol); mPEG-PLGA, mPEG-b-poly(LLA-co-GA); NPs, nanoparticles.
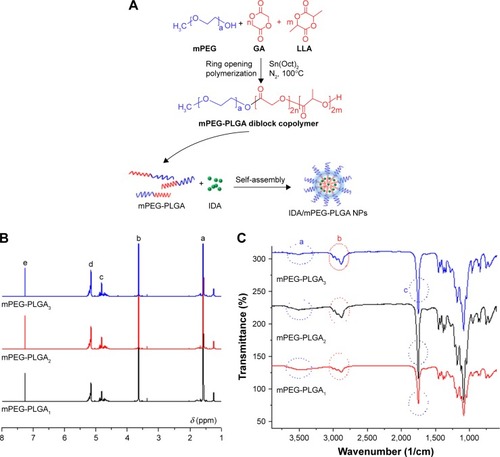
Table 1 Size, ZP distribution, DL, and EE of NPs and/or IDA/mPEG-PLGA NPs
Figure 2 TEM images of mPEG-PLGA1 NPs (A) and IDA/mPEG-PLGA NPs (B).
Abbreviations: IDA, idarubicin; mPEG-PLGA, methoxy poly(ethylene glycol)-b-poly(l-lactide-co-glycolide); NPs, nanoparticles; TEM, transmission electron microscopy.
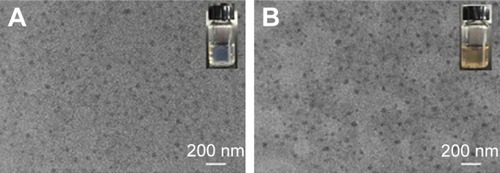
Figure 3 Standard curve of IDA and cumulative release of IDA/mPEG-PLGA NPs.
Notes: (A) Standard curve of IDA; images of IDA and IDA/mPEG-PLGA NPs after centrifugation separation. (B) Cumulative release of IDA/mPEG-PLGA NPs. Abbreviations: IDA, idarubicin; mPEG-PLGA, methoxy poly(ethylene glycol)-b-poly(l-lactide-co-glycolide); NPs, nanoparticles.
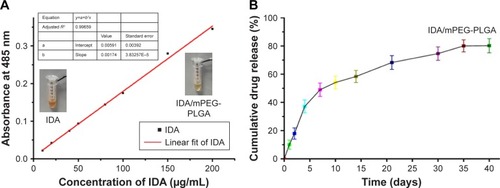
Table 2 IDA release in complete medium and PBS
Figure 4 Cytotoxicity of mPEG-PLGA1 NPs, IDA/mPEG-PLGA NPs, and IDA in L929 cells and normal human CD34+ HSPCs.
Notes: (A and B) The cell viability was measured in murine L929 cells and normal human CD34+ HSPCs treated with different concentrations of mPEG-PLGA1 NPs, IDA, and IDA/mPEG-PLGA1 NPs for 24 hours (**P<0.01 vs control group; NS, nonsignificant between control group and IDA/mPEG-PLGA NPs).
Abbreviations: HSPCs, hematological stem and progenitor cells; IDA, idarubicin; mPEG-PLGA, methoxy poly(ethylene glycol)-b-poly(l-lactide-co-glycolide); NPs, nanoparticles.
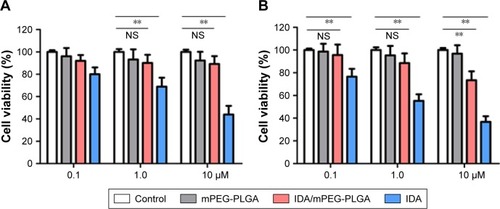
Figure 5 Pharmacokinetics and biodistribution analysis by ex vivo imaging system.
Notes: (A) Six-week-old wild-type C57BL/6J mice were intraperitoneally injected with IDA/mPEG-PLGA NPs. Liver, spleen, heart, lung, kidney, and intestine were dissected out after administration for 6 hours. The 540Ex/620Em was used to analyze DsRed fluorescence by IDA and captured by ex vivo imaging system. (B) Six-week-old wild-type C57BL/6J mice were intraperitoneally injected with IDA/mPEG-PLGA NPs. Bone marrow was dissected out after administration for 6 hours for subsequent ex vivo imaging analysis. (C) Ex vivo imaging analysis for liver and spleen, which were dissected out after mice were injected with IDA (3 mg/kg) or IDA/mPEG-PLGA NPs (3 mg/kg) for 2, 24, 48, and 96 hours.
Abbreviations: IDA, idarubicin; mPEG-PLGA, methoxy poly(ethylene glycol)-b-poly(l-lactide-co-glycolide); NPs, nanoparticles.
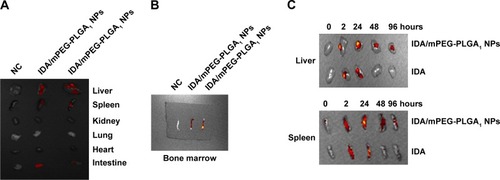
Figure 6 mPEG-PLGA enhances the cellular uptake of IDA.
Notes: PE fluorescence by IDA was measured by flow cytometry in HL-60, which were treated with 0.1 µM IDA or 0.1 µM IDA/mPEG-PLGA NPs for 6 hours. Shown is the representative plots (left) and summary of PE+ cells (right).
Abbreviations: IDA, idarubicin; mPEG-PLGA, methoxy poly(ethylene glycol)-b-poly(l-lactide-co-glycolide); NPs, nanoparticles; PE, phycoerythrin.
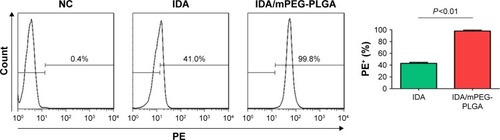
Figure 7 Antileukemia activity of IDA and IDA/mPEG-PLGA NPs in leukemia cells in vitro.
Notes: (A) HL-60 and U937 cells were treated with different concentrations of IDA or IDA/mPEG-PLGA for 24 hours. Cell growth was measured by the MTT assay. IC50 was calculated for HL-60 and U937 cells. Apoptosis was measured by annexin V/PI staining in HL-60 (B) and U937 (C) cells, which were treated with 0.01 µM IDA/mPEG-PLGA NPs, 0.01 µM IDA, or mPEG-PLGA NPs for 4 days. *P<0.01.
Abbreviations: IC50, half maximal inhibitory concentration; IDA, idarubicin; mPEG-PLGA, methoxy poly(ethylene glycol)-b-poly(l-lactide-co-glycolide); NPs, nanoparticles; PI, propidium iodide.
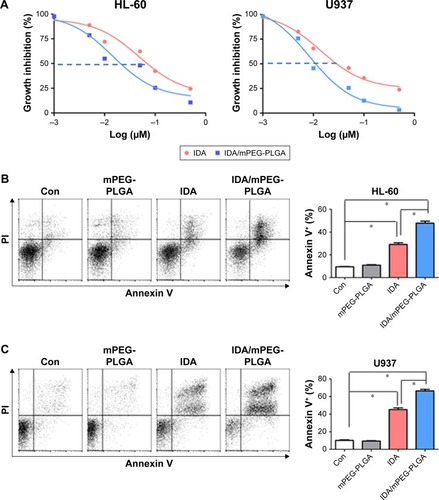
Figure 8 Antileukemia activity of IDA and IDA/mPEG-PLGA in MLL-AF9-induced murine leukemia in vivo.
Notes: (A) GFP+ cells were measured in BM from the MLL-AF9-induced murine leukemia treated with IDA/mPEG-PLGA NPs, IDA, mPEG-PLGA, or vehicle when vehicle mice developed full-blown leukemia (n=4). Shown is the representative plots (left) and summary of GFP+ cells (right). **P<0.01. (B) A representative image of blood, BM, and spleen smears in the MLL-AF9-induced leukemia treated with IDA/mPEG-PLGA NPs, IDA, mPEG-PLGA, or vehicle. (C) A representative image of spleen (left) and summary of spleen weight (right) from the MLL-AF9-induced leukemia treated with IDA/mPEG-PLGA NPs, IDA, mPEG-PLGA, or vehicle (n=4). **P<0.01. (D) Overall survival was analyzed in the MLL-AF9-induced leukemia treated with IDA/mPEG-PLGA NPs, IDA, mPEG-PLGA, or vehicle (n=6). **P<0.01.
Abbreviations: BM, bone marrow; IDA, idarubicin; mPEG-PLGA, methoxy poly(ethylene glycol)-b-poly(l-lactide-co-glycolide); NPs, nanoparticles.
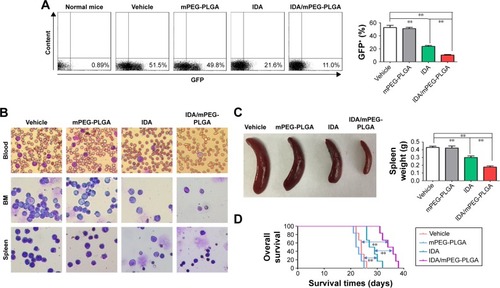
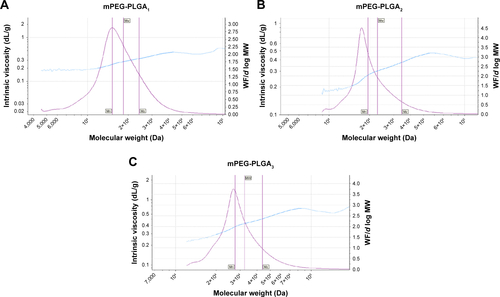
Figure S1 (A–C) GPC data for mPEG-PLGA1, mPEG-PLGA2, and mPEG-PLGA3.
Abbreviations: GPC, gel permeation chromatography; mPEG-PLGA, methoxy poly(ethylene glycol)-b-poly(l-lactide-co-glycolide); MW, molecular weight.