Figures & data
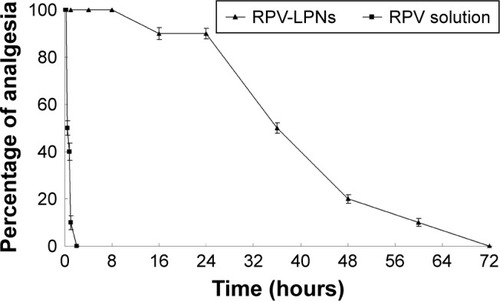
Figure 1 The composition and schematic diagram of RPV-LPNs.
Notes: RPV-LPNs were prepared by the w/o/w double emulsification method. PCL, PEG-DSPE and lecithin as lipophilic surfactant were dissolved in acetone. RPV was dissolved in sodium dodecyl sulfate solution to form the internal aqueous phase. The resultant nano-emulsion was poured into a Pluronic® F-127 solution and was sonicated again for 5 minutes in an ice bath.
Abbreviations: PEG-DSPE, poly(ethylene glycol)-distearoylphosphatidylethano lamine; PCL, poly-ε-caprolactone; RPV, ropivacaine; LPNs, lipid-polymer hybrid nanoparticles.
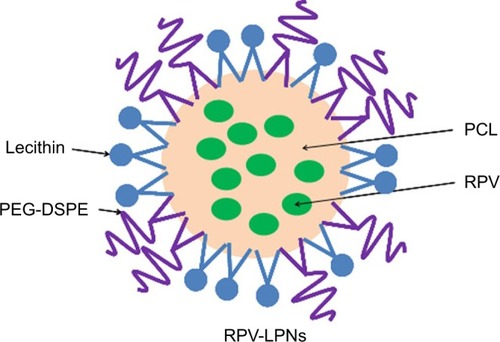
Table 1 Characterization of LPNs (Mean ± SD, N=3)
Figure 2 In vitro drug release behaviors of LPNs and the solution depicted as the cumulative RPV release (%) vs time.
Notes: Data represent mean ± SD, N=3. Release of RPV from the LPNs was studied following the dialysis bag method. The bags were placed in a glass beaker containing 0.2 L of PBS (pH 7.4) at 37.0°C±0.5°C and stirred at 100 rpm. At pre-set time intervals, 1 mL of the medium was collected and analyzed for RPV content by HPLC.
Abbreviations: RPV, ropivacaine; LPNs, lipid-polymer hybrid nanoparticles.
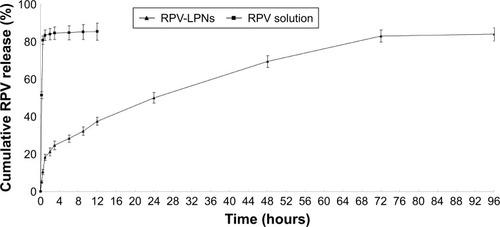
Figure 3 In vitro cytotoxicity of RPV-LPNs, E-LPNs, and RPV solution evaluated by assaying the BALB/c-3T3 fibroblast viability.
Notes: Data represent mean ± SD, N=6. *P<0.05. Various doses of RPV-LPNs, E-LPNs, and RPV solution were added to the 48-well plate incubating cells. The amount of MTT converted to formazan was measured to determine the percentage of viable cells, using a microplate reader at a wavelength of measured at 570 nm.
Abbreviations: RPV, ropivacaine; LPNs, lipid-polymer hybrid nanoparticles.
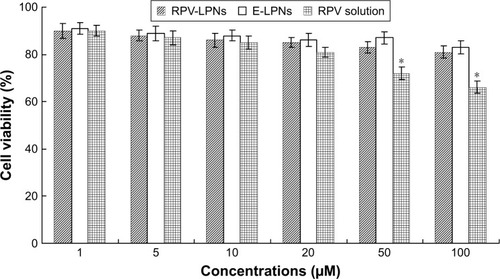
Figure 4 Ex vivo permeation of profiles RPV-LPNs and RPV solution.
Notes: Data represent mean ± SD, N=6. *P<0.05. RPV-LPNs and RPV solution were applied to the epidermal surface of skin, respectively. At pre-set time intervals, samples were collected from the receiver and analyzed for the permeated amount of RPV by HPLC method.
Abbreviations: RPV, ropivacaine; LPNs, lipid-polymer hybrid nanoparticles.
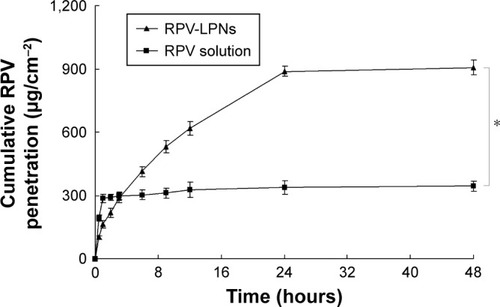
Figure 5 In vivo anesthesia effect of LPNs was investigated in rats by TFL test.
Notes: Data represent mean ± SD, N=10. Samples were applied on the tail of the rats, which were placed in a plastic box; the ventral surface of the distal 5–6 cm of the tail was placed over a 0.5 cm hole, beneath which an infrared radiant bulb was placed.
Abbreviations: RPV, ropivacaine; LPNs, lipid-polymer hybrid nanoparticles.
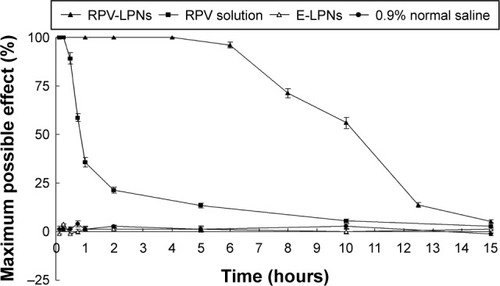
Figure 6 In vivo analgesia duration results evaluated in mice.
Notes: Data represent mean ± SD, N=10. Testing for analgesia was done by a vocal response to electrical stimulation at the skin directly overlying the abdomen at the site of injection using a current generator. RPV-LPNs, RPV solution, E-LPNs, and 0.9% normal saline samples were injected subcutaneously into the abdomen of the mice, followed by determination of analgesia at the desired time points.