Figures & data
Figure 1 Triple point phase diagram for pure CO2.Citation7,Citation14
Note: Adapted with permission from: Ginty PJ, Whitaker MJ, Shakesheff KM, Howdle SM. Drug delivery goes supercritical. Materials Today. 2005;8(8) Suppl 1: 42–48. Copyright 2005 American Chemical Society; and: reprinted from International Journal of Pharmaceutics, vol 364, Are pharmaceutics really going supercritical?, pages 176–187, copyright 2008, with permission from Elsevier.
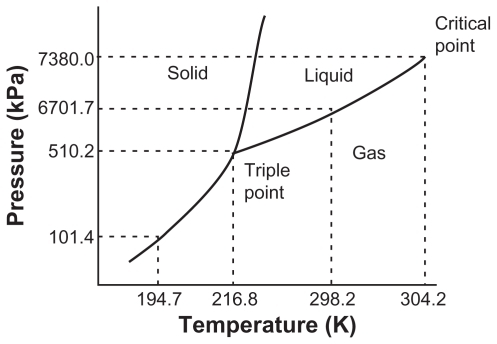
Figure 2 Schematic diagram of the apparatus for the supercritical antisolvent process.
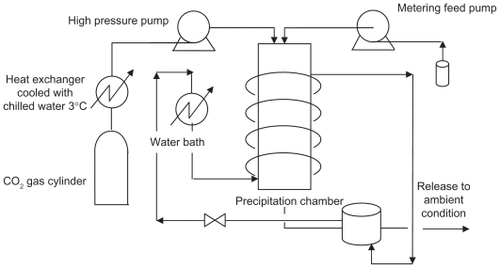
Table 1 Summary of literature reviews
Figure 3 Density dependence of CO2 at various temperatures.Citation17
Note: Reproduced from Gupta and Kompella with permission from the publisher.
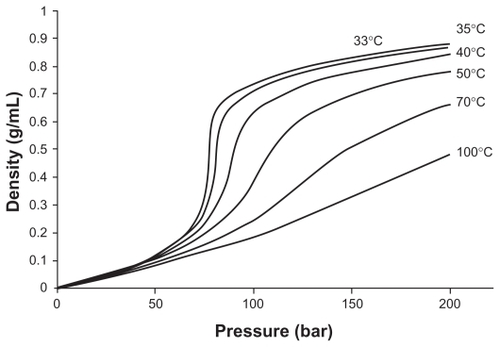
Figure 4 The two mechanisms in competition for particles formation during the supercritical antisolvent process at P > PC and XCO2 ≥ XMCP.Citation22
Note: Reprinted from The Journal of Supercritical Fluids, vol 47, Reverchon E, Adami R, Caputo G, De Marco I, Spherical microparticles production by supercritical antisolvent precipitation: interpretation of results, pages 70–84, copyright 2008, with permission from Elsevier.
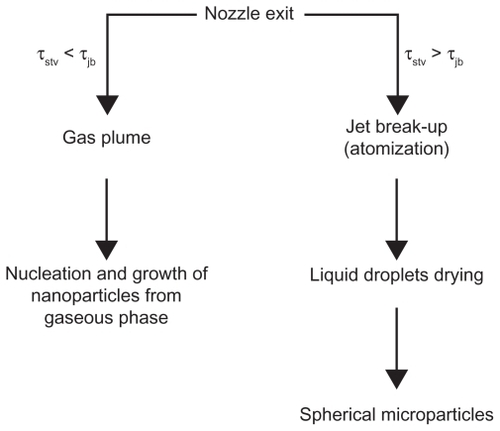
Figure 5 Coaxial nozzle employed for the simultaneous introduction of the organic solution and the supercritical antisolvent process.Citation34
Note: Reprinted with permission from Kalogiannis CG, Pavlidou E, Panayiotou CG. Production of amoxicillin microparticles by supercritical antisolvent precipitation. Ind Eng Chem Res. 2005;44:9339–9346. Copyright 2005 American Chemical Society.
Abbreviation: SF, supercritical fluid.
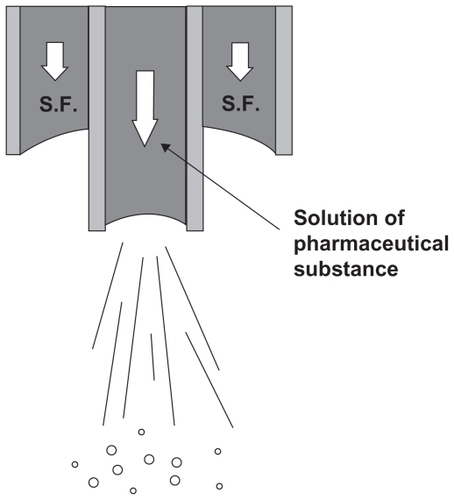
Table 2 Effects of the process parameters on the particle size in the supercritical antisolvent (SAS) process
Figure 6 Qualitative diagram pressure versus CO2 molar reaction.Citation22
Note: Reprinted from The Journal of Supercritical Fluids, vol 47, Reverchon E, Adami R, Caputo G, De Marco I, Spherical microparticles production by supercritical antisolvent precipitation: interpretation of results, pages 70–84, copyright 2008, with permission from Elsevier.
Abbreviation: MCP, melting critical point.
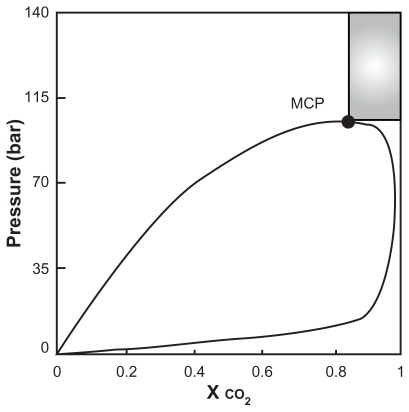
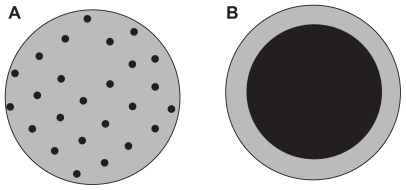
Figure 7 A schematic of a matrix structure (A), and encapsulated structure (B).