
Figures & data
Table 1 Factors and responses used in Scheffé’s mixture design
Figure 1 Solubility of ticagrelor in various excipients.
Notes: (A) Oils. (B) Surfactants and cosurfactants. Values are expressed as mean ± SD (n=3).
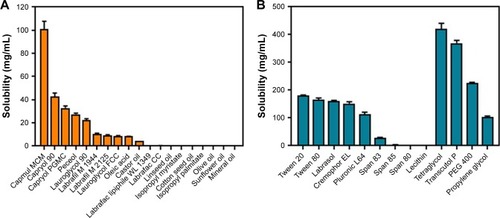
Table 2 Evaluation of emulsification and phase separation according to the combination of preselected excipients
Figure 2 Pseudoternary phase diagram.
Notes: (A) Capmul MCM, Cremophor EL, and Transcutol P. (B) Capmul MCM, Tween 20, and Transcutol P. Green line, red line, and blue line indicate compositions forming microemulsion of the grade A, grade B, and grade C, respectively.
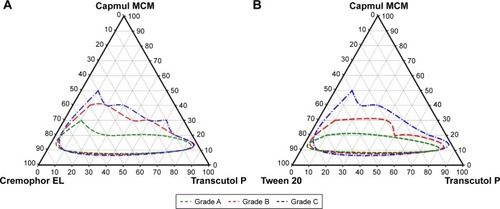
Table 3 Summary of model fitting and statistical analysis
Figure 3 Three-dimensional surface plots of responses.
Notes: (A) Y1: Solubility of TCG in SMEDDS. (B) Y2: Precipitation. (C) Y3: Droplet size. (D) Y4: Transmittance.
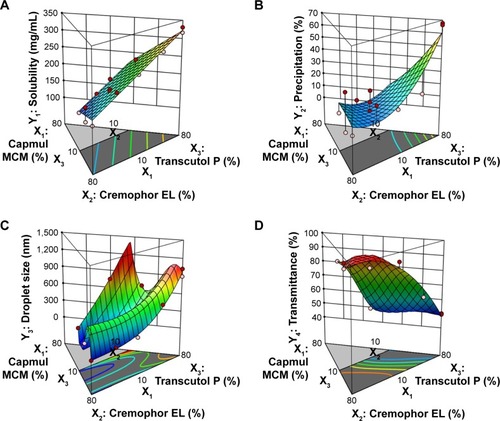
Table 4 Predicted values and actual values of optimized TCG-SM
Figure 4 (A) Desirability plot using numerical optimization. (B) Transmission electron microscopy images and an electrophoretic laser scattering measurement of optimized ticagrelor-loaded self-microemulsifying drug delivery system in corresponding distilled water. Scale bar 200 nm.
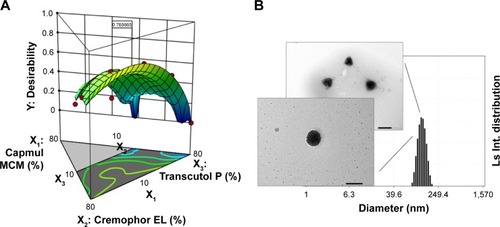
Figure 5 Dissolution profile of Brilinta®, TCG-CE, and TCG-SM in (A) pH 1.2 media, (B) pH 4.0 media, (C) pH 6.8 media, and (D) distilled water.
Notes: Values are expressed as mean ± SD (n=3).
Abbreviations: TCG-SM, ticagrelor-loaded self-microemulsifying drug delivery system; TCG-CE, ticagrelor-loaded Cremophor EL.
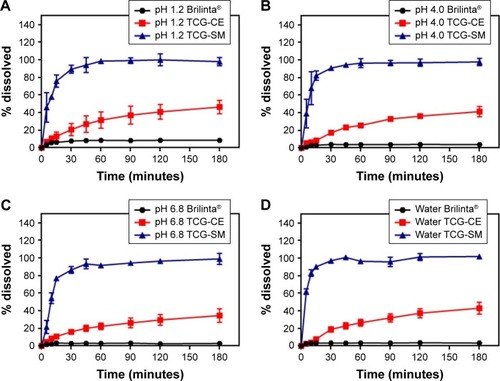
Figure 6 (A) Cell viability of Caco-2 as a function of TCG corresponding concentration for raw TCG solution, blank-CE, TCG-CE, blank-SM, and TCG-SM. (B) Caco-2 cellular uptake of TCG treated with raw TCG solution, TCG-CE, and TCG-SM after incubation for 4 hours. (C) Papp of raw TCG solution, TCG-CE, and TCG-SM across Caco-2 cell monolayer.
Notes: (A) Values are expressed as mean ± SD (n=4). (B) Values are expressed as mean ± SD (n=4). *P<0.05 vs raw TCG solution, #P<0.05 vs TCG-CE. (C) Values are expressed as mean ± SD (n=4). *P<0.05 vs raw TCG solution, #P<0.05 vs TCG-CE.
Abbreviations: blank-CE, Cremophor EL without ticagrelor; blank-SM, self-microemulsifying drug delivery system without ticagrelor; CE, Cremophor EL; Papp, apparent permeability coefficients; SM, self-microemulsifying drug delivery system; TCG-CE, ticagrelor-loaded Cremophor EL; TCG-SM, ticagrelor-loaded self-microemulsifying drug delivery system; TCG, ticagrelor.
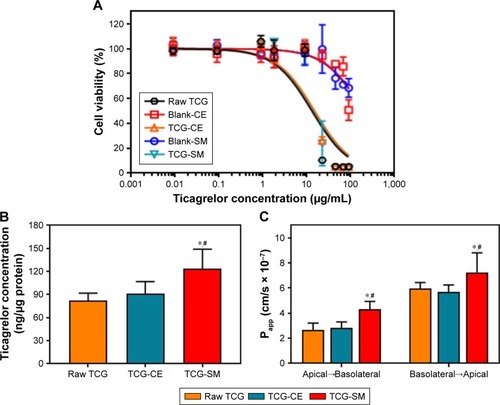
Table 5 In vivo pharmacokinetic parameters of TCG in rats after oral administration of raw TCG suspension, TCG-CE, and TCG-SM
Figure 7 Mean plasma concentration–time profiles of TCG in rats after oral administration of raw TCG suspension, TCG-CE, and TCG-SM at a dose equivalent to 10 mg/kg of TCG.
Note: Values are expressed as mean ± SD (n=11).
Abbreviations: TCG, ticagrelor; TCG-CE, ticagrelor-loaded Cremophor EL; TCG-SM, ticagrelor-loaded self-microemulsifying drug delivery system.
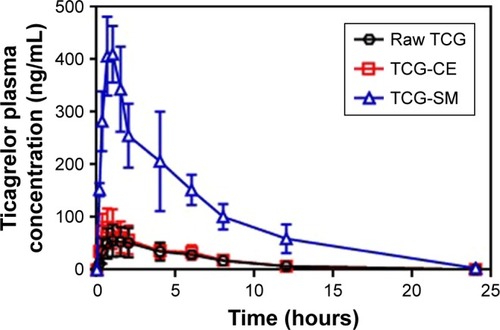
Figure 8 In vitro concentration–response curves for TCG inhibitory actions on ADP-induced platelet aggregations of raw TCG suspension and TCG-SM.
Notes: EC50 was defined as the concentration of the drug that inhibits platelet aggregation to 50%. Values are expressed as mean ± SEM (n=3).
Abbreviations: EC50, 50% effective concentration; SEM, standard error of mean; TCG, ticagrelor; TCG-SM, ticagrelor-loaded self-microemulsifying drug delivery system.
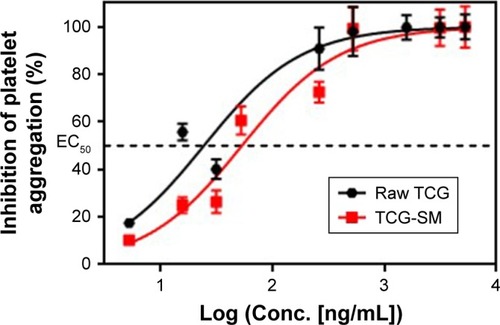
Table 6 Ex vivo pharmacodynamic parameters of TCG in rats after oral administration of raw TCG suspension and TCG-SM with dose of 2, 5, and 10 mg/kg
Figure 9 (A) Ex vivo antiplatelet activity evaluation of raw TCG suspension and TCG-SM according to dose of 2, 5, and 10 mg/kg. (B) Dose–response curve for ADP-induced platelet aggregation in TCG according to time-points (2, 5, and 10 hours) after oral administration of raw TCG suspension and TCG-SM.
Notes: (A) Values are expressed as mean ± SEM (n=9). (B) ED50 was defined as the dose of the drug that inhibits platelet aggregation to 50%. Values are expressed as mean ± SEM (n=9).
Abbreviations: ED50, 50% effective dose; SEM, standard error of mean; TCG, ticagrelor; TCG-SM, ticagrelor-loaded self-microemulsifying drug delivery system.
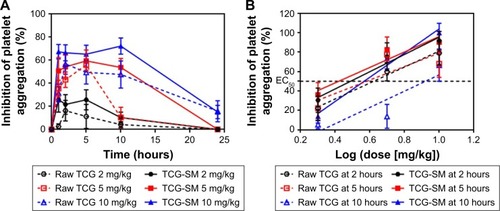
Figure 10 Main design and result for the development of TCG-SM.
Abbreviations: BCS, Biopharmaceutical Classification System; blank-CE, Cremophor EL without ticagrelor; blank-SM, self-microemulsifying drug delivery system without ticagrelor; CE, Cremophor EL; TCG, ticagrelor; TCG-SM, ticagrelor-loaded self-microemulsifying drug delivery system.
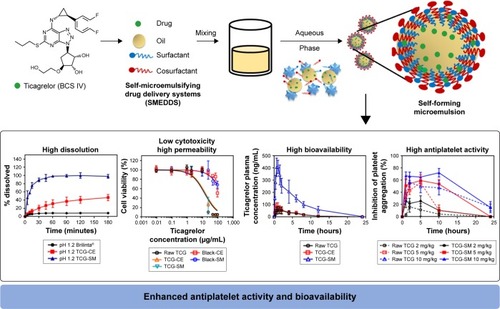
Figure S1 (A) Apical-basolateral (A–B) transport of TCG across Caco-2 cell monolayer for 180 minutes. (B) Basolateral-apical (B–A) transport of TCG across Caco-2 cell monolayer for 180 minutes.
Notes: Values are expressed as mean ± SD (n=4).
Abbreviations: TCG, ticagrelor; TCG-CE, ticagrelor-loaded Cremophor EL; TCG-SM, ticagrelor-loaded self-microemulsifying drug delivery system.
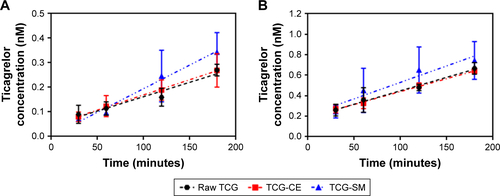
Table S1 The classification standards of emulsification grade
Table S2 Coefficient equations of responses according to the level of factors
Table S3 The experimental composition and observed responses through Scheffé’s mixture design