Figures & data
Figure 1 Decitabine (C12)2 synthesis.
Abbreviations: DCC, dicyclohexylcarbodiimide; DMAP, 4-(dimethylamino) pyridine.
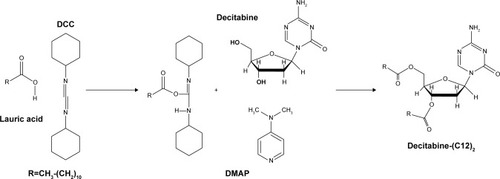
Figure 2 Preparation of lipid nanocapsules loaded with decitabine (C12)2 by phase inversion temperature.
Abbreviation: LNCs, lipid-core nanocapsules.
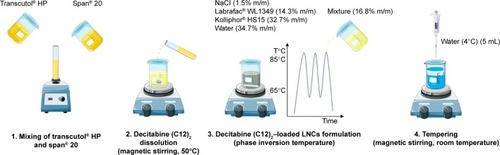
Table 1 Gradient elution in the LC-MS/MS method
Table 2 Physiochemical characterizations of blank and loaded LNC formulations (n=3)
Figure 3 Physiochemical behavior of decitabine (C12)2 PBS-loaded LNCs in PBS at 37°C for 48 hours (n=3). Drug loading and residual decitabine (C12)2 concentration remained unchanged for the first 12 hours and decreased thereafter (A), whereas the size and PDI remained unchanged for 48 hours (B).
Abbreviations: LNC, lipid-core nanocapsule; PDI, polydispersity index.
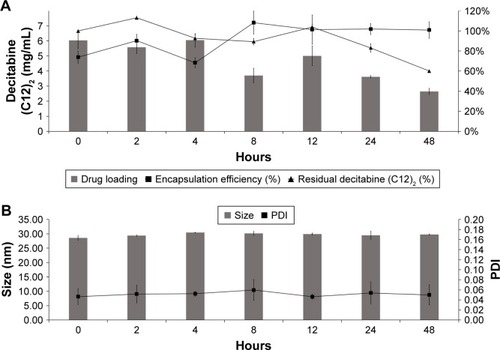
Figure 4 Decitabine (C12)2 stability in human plasma. Decitabine (C12)2-loaded LNCs were incubated in human plasma at 37°C for 24 hours. The decitabine-(C12)2 concentration at the initial timepoint (T0) was considered to be 100% (n=3).
Abbreviation: LNCs, lipid-core nanocapsules.
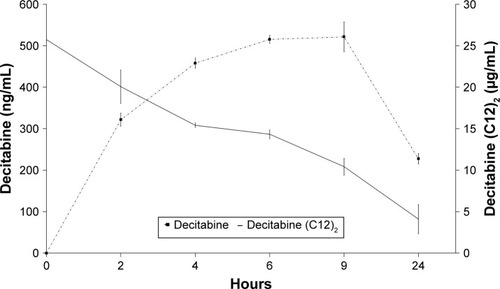
Figure 5 Cell proliferation study of HEL following exposure to various concentrations of blank LNCs (indicated below each bar graph), decitabine solution, decitabine (C12)2-loaded LNCs, or decitabine (C12)2 solution. Cells cultured with medium alone were considered to correspond to 100% viability (n=3 plates, quadruplicate).
Note: *P<0.05 Mann–Whitney test.
Abbreviations: HEL, human erythroleukemia cell line; LNCs, lipid-core nanocapsules.
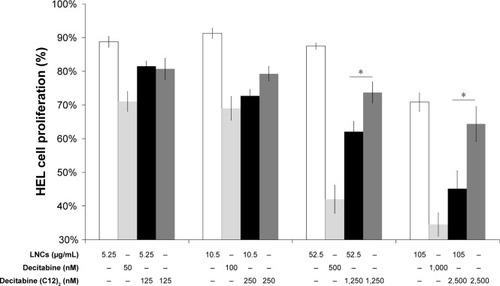
Figure 6 Cell-cycle analysis of HEL cells following exposure to RPMI (A), blank LNCs (B), decitabine solution (C), or decitabine (C12)2-loaded LNCs (D) also as expressed as a percentage of cells blocked in G2/M phase (E) (n=3 plates, in triplicate).
Note: *P<0.05 Mann–Whitney test vs cells treated with RPMI.
Abbreviations: HEL, human erythroleukemia cell line; LNCs, lipid-core nanocapsules; RPMI, Roswell Park Memorial Institute medium 1640.
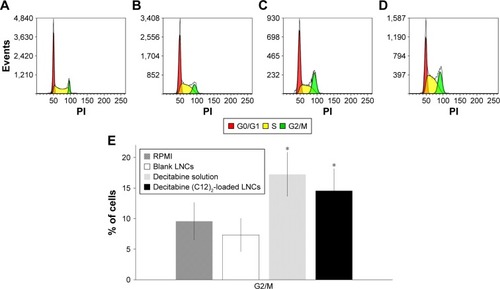
Table 3 Main pharmacokinetic parameters of decitabine and decitabine (C12)2 following IV administration of 5 mg/kg decitabine or 12.5 mg/kg decitabine (C12)2
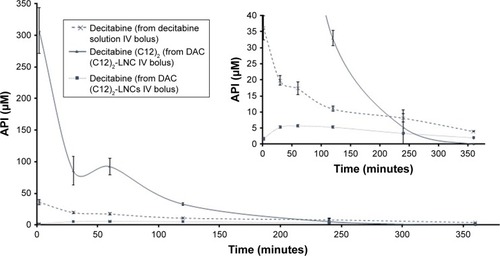
Figure 7 Evolutions of plasma concentrations of active pharmaceutical ingredients over time following IV bolus administration of a decitabine solution or a decitabine (C12)2-loaded LNCs solution.
Note: Results are presented as mean±SEM (n=5 for each group).
Abbreviations: API, active pharmaceutical ingredient; DAC, decitabine; IV, intravenous; LNCs, lipid-core nanocapsules; SEM, standard error of the mean.