Figures & data
Table 1 Formulation variables and their levels in Box–Behnken design
Table 2 Box–Behnken experimental design and their observed responses
Figure 1 (A) NAT lipid solubility, 3D response surface and perturbation plots of the prepared NAT-SLNs showing effect of selected independent variables on (B) PS, (C) ZP, and (D) EE%.
Abbreviations: NAT, natamycin; NAT-SLN, NAT solid lipid nanoparticle; PS, particle size; 3D, three dimensional; ZP, zeta potential; EE%, entrapment efficiency.
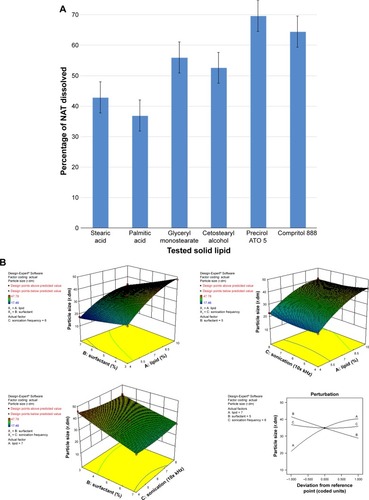
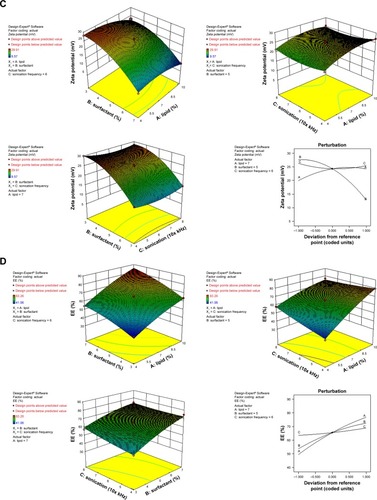
Table 3 Evaluation of primary NAT-SLNs prepared for the selection of appropriate SAA
Table 4 Results of regression analysis and ANOVA for the response surface quadratic model
Table 5 Coefficients of different formula variables according to the best fit response surface model
Table 6 Composition of selected checkpoints by comparing predicted and observed values for different responses and prediction error
Figure 2 (A) Ramp graph and (B) contour plot of desirability for numerically optimized NAT-SLN formulations F1 and F2.
Abbreviations: NAT, natamycin; NAT-SLN, NAT solid lipid nanoparticle.
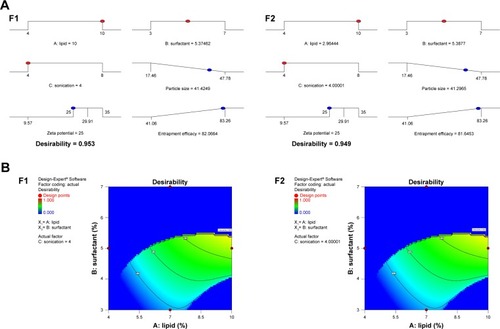
Figure 3 (A) Dissolution profiles, solid state characterization of optimized NAT-SLN using (B) DSC and (C) IR.
Abbreviations: NAT, natamycin; NAT-SLN, NAT solid lipid nanoparticle; DSC, differential scanning calorimetry; IR, infrared.
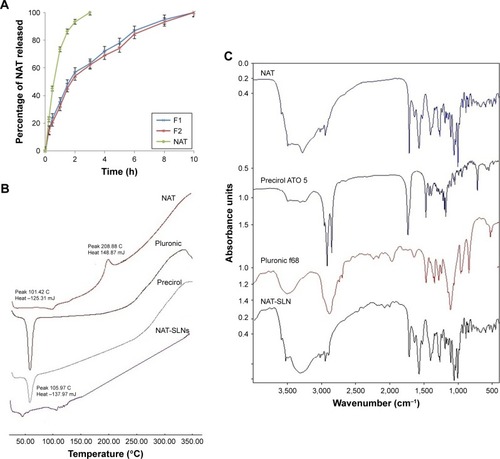
Table 7 Antifungal susceptibility to NAT and NAT-SLN
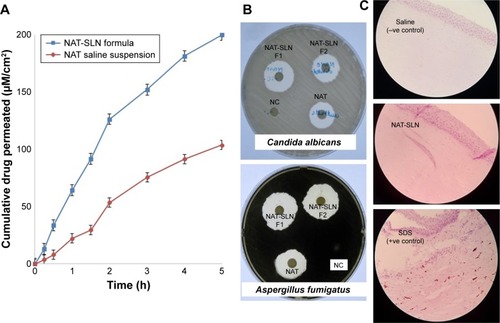
Figure 4 (A) NAT corneal permeation profile, (B) antifungal susceptibility testing, and (C) histopathological studies of optimized NAT-SLN formula.
Abbreviations: NAT, natamycin; NAT-SLN, NAT solid lipid nanoparticle.