Figures & data
Table S1 Linkage to scFv does not affect liposomal zeta potential or DXR encapsulation
Figure 1 Stability of liposomal formulation in HEPES and 100% FBS at 37°C over time.
Notes: The leakage of encapsulated DXR from liposomes (DXR-L, DXR-L scFv G8, and DXR-L scFv Hyb3) in different media and incubation times is shown. In black, measurements in HEPES are shown and in color, measurements done in FBS are shown: blue, DXR-L; purple, DXR-L scFv G8; and green, DXR-L scFv Hyb3. (A) Stability of DXR liposomes during 1 hour of incubation in HEPES and 100% FBS at 37°C. Lines represent the continuous drug fluorescence measured (at every second). (B) Stability of DXR liposomal formulations up to 24 hours in HEPES and 100% FBS at 37°C. Dots correspond to sampling time points and bars correspond to the standard error mean. These experiments were done with three independent batches of each formulation.
Abbreviations: DXR, doxorubicin; DXR-L, DXR-loaded liposome.
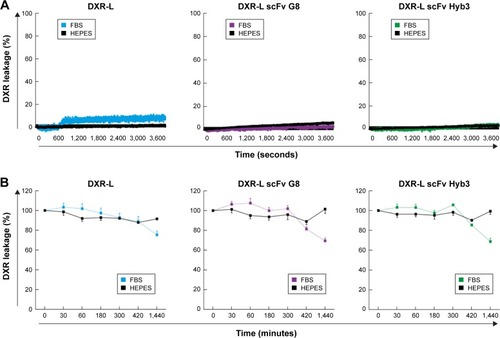
Figure 2 Interaction of liposomal formulations with tumor cells in vitro.
Notes: Fluorescence signal of liposomes on cells is shown. Flow cytometry was performed on all four cell lines at 37°C for 2 hours and CF signal (lipids) (A) and DXR signal (B) was recorded. Cells were incubated with DXR-Ls and allowed to bind and/or internalize. Bars represent the average and standard error mean of three independent experiments of all cell lines tested. *P<0.05. (C) Live-cell confocal imaging of cells exposed to all the DXR-L formulations for 1 hour and incubated for additional 24 hours with medium. (i) MZ2Mel43 (M1+/A1+), (ii) G43 (M1+/A1+), (iii) Mel78 (M1−/A1+), and (iv) Mel2A (M1−/A1+) cells. Nuclei are stained with Hoechst and are shown in blue; liposomes had CF-PE in the bilayer and are shown in green, DXR in red, and bright field in black and white contrast.
Abbreviations: DXR, doxorubicin; DXR-Ls, DXR-loaded liposomes.
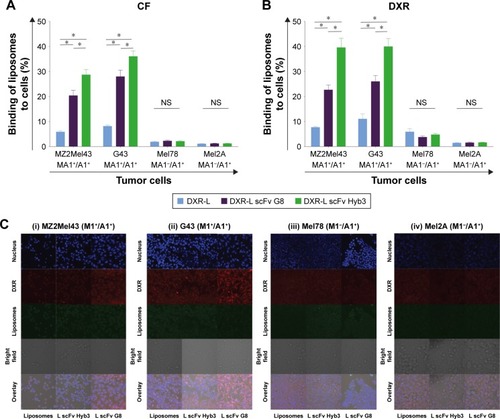
Figure 3 Melanoma cell survival after exposure to liposomal formulations.
Notes: (A) M1+/A1+ (MZ2Mel43 and G43) and M1−/A1+ (Mel2A and Mel78) melanoma cell lines were exposed to free DXR and DXR-L formulations (nontargeted and targeted) for 10, 30, 60, and 120 minutes. Medium was refreshed and cells were incubated until 72 hours. Data are presented as the mean percentage and standard error mean of three independent batches (i) MZ2Mel43 (M1+/A1+) cells, (ii) G43 (M1+/A1+), (iii) Mel78 (M1−/A1+), and (iv) Mel2A (M1−/A1+) cells. DXR concentration (µM) is on x-axis and cell survival in percentage is on y-axis. Mann–Whitney U test was used to compare treatments with each other. **P<0.01. (B) Cellular viability curves from (A) were used to calculate IC50 values (µM) for various melanoma cell lines and treatments. The concentration >50 is indicated in case IC50 was not reached even at 50 µM.
Abbreviations: DXR, doxorubicin; DXR-L, DXR-loaded liposome.
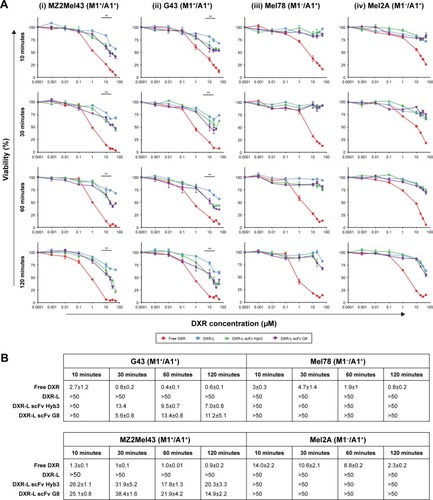
Figure 4 Blood circulation profile of immunoliposomes in nontumor-bearing mice.
Notes: Mice were systemically injected with DXR-L formulations at 4 mg/kg DXR dose. Blood was drawn from tail vein at different time intervals depicted in dots. Amount of DXR (µM) was as determined in plasma after liposome injection (as a measure of loss of liposome integrity). DXR release (y-axis) over 24 hours is presented against time in hours (x-axis). Data are presented as mean value and standard error mean of n=6 mice.
Abbreviations: DXR, doxorubicin; DXR-L, DXR-loaded liposome.
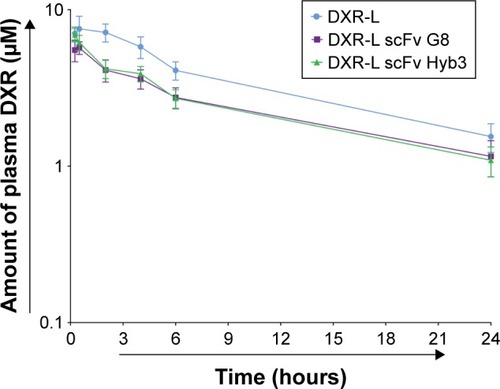
Figure 5 Tissue distribution of immunoliposomes in tumor-bearing mice.
Notes: Quantification of DXR in different organs at 6 hours following treatment with free DXR or DXR-L formulations at 4 mg/kg DXR dose in tumor-bearing mice. Tumors were derived from G43 (M1+/A1+) or Mel78 (M1–/A1+) cell lines. Data are represented as mean values and standard mean error of n=3–6 and displayed per organ. (A) Tumor, (B) liver, (C) kidney, (D) spleen, (E) lung, and (F) heart.
Abbreviations: DXR, doxorubicin; DXR-L, DXR-loaded liposome.
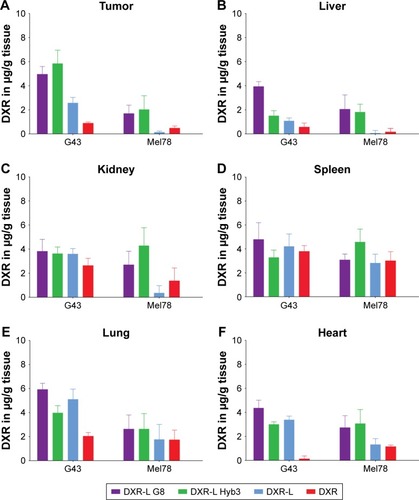
Figure 6 DXR-L scFvs show significant and sustained antimelanoma effect.
Notes: Tumor growth in tumor-bearing mice derived from melanoma cell lines following treatment with PBS, free DXR, or DXR-Ls. G43 (M1+/A1+) tumors were treated with 4 (A) and 2 mg/kg (B) DXR dose. Mel78 (M1–/A1+) tumors were treated with 4 (C) and 2 mg/kg (D) DXR dose. Mice were injected four times with 4 mg/kg DXR-Ls or eight times with 2 mg/kg DXR-Ls. Data are represented as mean tumor size index values (tumor volume at any given point in comparison with initial tumor volume) and SD of n=4–7. Starting size of all tumors was 100 mm3. *P<0.05; **P<0.01. (E) Tumor size indexes after treatment with immunoliposomes, summary of tumor responses from A to D per tumor type and treatments (PBS, free DXR, and DXR-L formulations). Data are represented as average of tumor size index values ± SD of n=4–7 individual mice after first and fourth treatments. The percentage of mice with a tumor size index above 5 is listed (%). Statistical significance was calculated by Mann–Whitney U test comparing G43 tumor vs Mel78 tumor data according to treatment, dose, and time point.
Abbreviations: DXR, doxorubicin; DXR-Ls, DXR-loaded liposomes.
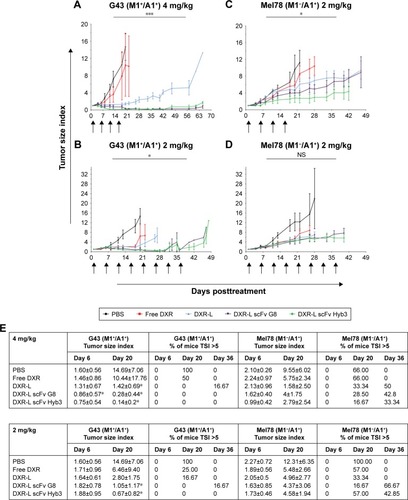
Figure S1 Anti-MAGE-A1/HLA-A1 TCR T-cells show activation after binding to MAGE-A1/HLA-A1+ melanoma cells.
Notes: T-cells were incubated with APD and melanoma cells. Data are shown as dot plots for CD107a-PE fluorescence and CD8-APC signal measured on APD cells either pulsed with M1 peptide or not, in comparison with signal on melanoma cells. T-cells incubated in medium only were used as controls. Dot plots show all cells positive for CD8 but only when MAGE A1 is expressed in HLA-A1 context; CD107a signal appears, hence showing the expression of MA1/A1 on MZ2Mel43 and G43 cells.
Abbreviations: APC, allophycocyanin; HLA-A, human leukocyte antigen A; MAGE-A1, melanoma antigen A1; TCR, T-cell receptor; WT, wild type.
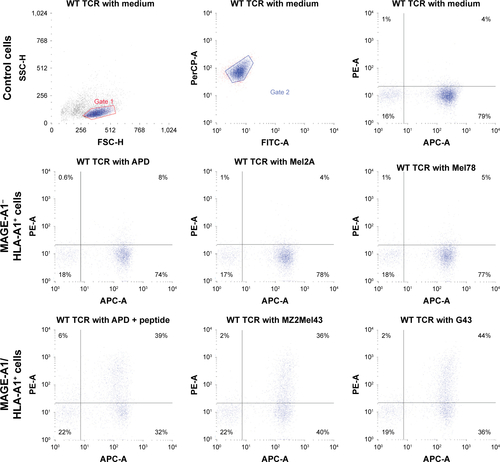
Figure S2 Immunoliposomes bind to cognate peptide.
Notes: DXR-L formulations were incubated with APD cells. Data are shown as histograms for NBD fluorescence and DXR signal on APD cells pulsed with M1 peptide, in comparison with signal from NBD and DXR on APD cells without M1 peptide. Percentage fluorescence of positive cells is given as measured by flow cytometry. Empty histograms represent APD cells with M1 peptide, red filled represents free DXR used as positive control, blue-filled histograms represent NBD-labeled DXR-Ls, green-filled histograms represent NBD-labeled DXR-L scFv Hyb3, and purple-filled represent NBD-labeled DXR-L scFv G8.
Abbreviations: DXR, doxorubicin; DXR-L, DXR-loaded liposome.
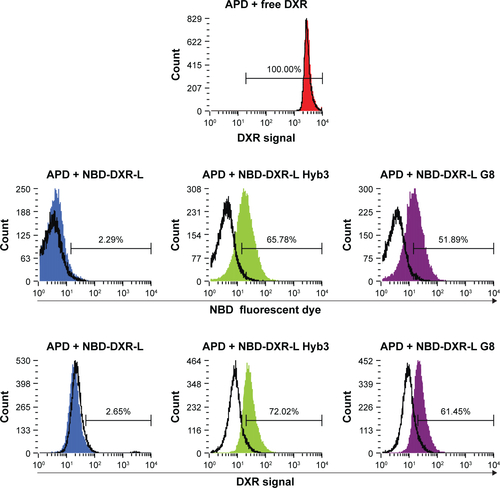
Figure S3 Survival of tumor-bearing mice derived from melanoma cell lines following treatment with PBS, free DXR, or DXR-Ls.
Notes: G43 (M1+/A1+) tumors were treated with 4 (A) and 2 mg/kg (B) DXR dose. Mel78 (M1−/A1+) tumors were treated with 4 (C) and 2 mg/kg (D) DXR dose. Data are represented as percentage survival (n=4–7) and standard error mean. Significance was calculated by Mantel–Cox test for tumor data and compared the tumors treated with same dose of various treatments. *P<0.05; ***P<0.001. (E) Mean survival in days, days of survival of tumor-bearing mice derived from melanoma cell lines following treatment with PBS, free DXR, or DXR-Ls. G43 (M1+/A1+) tumors were treated with 4 and 2 mg/kg DXR dose and showed a higher survival than Mel78 (M1−/A1+) tumors treated with 4 and 2 mg/kg DXR dose. Data are represented as mean values. Significance was calculated by Mantel–Cox test and P (value) represents statistical significance for G43 tumor data and Mann–Whitney U test compares the tumors treated with same dose of various treatments.
Abbreviations: DXR, doxorubicin; DXR-Ls, DXR-loaded liposomes.
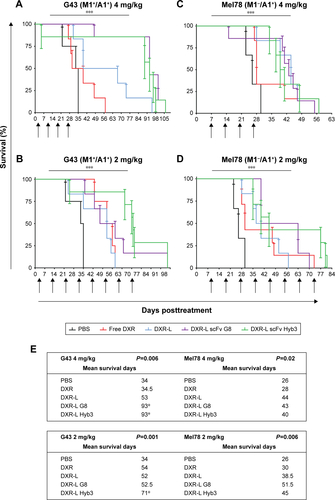
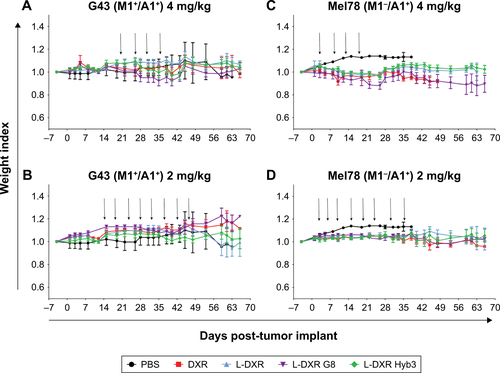
Figure S4 Weight loss of tumor-bearing mice derived from melanoma cell lines following treatment with PBS, free DXR, or DXR-Ls. G43 (M1+/A1+) tumors were treated with 4 (A) and 2 mg/kg (B) DXR-L dose. Mel78 (M1−/A1+) tumors were treated with 4 (C) and 2 mg/kg (D) DXR-L dose. Data are represented as mean weight index values (n=4–7) and SD.
Abbreviations: DXR, doxorubicin; DXR-Ls, DXR-loaded liposomes.