Figures & data
Figure 1 Molecular structure of banana peel.
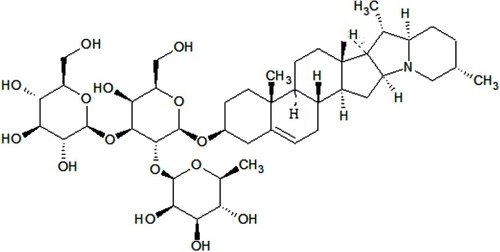
Figure 2 HRTEM morphology of NPs (A) before and (B) after drug loading on NPs.
Abbreviations: HRTEM, high-resolution transmission electron microscopy; NPs, nanoparticles.
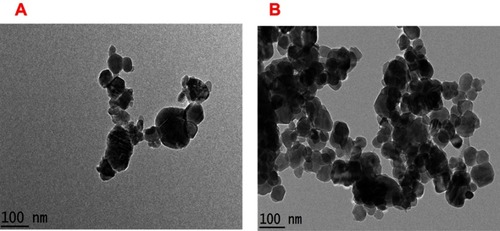
Figure 3 Field-emission scanning electron microscopy morphologies of nanoparticles (A) before and (B) after drug loading.
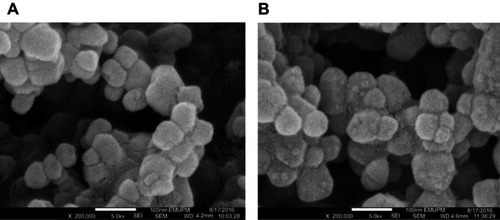
Figure 4 Zeta potential representations (A) showed the distribution of nanoparticles (NPs) derived from cockleshells, (B) doxorubicin NPs, and (C) zeta size representations.
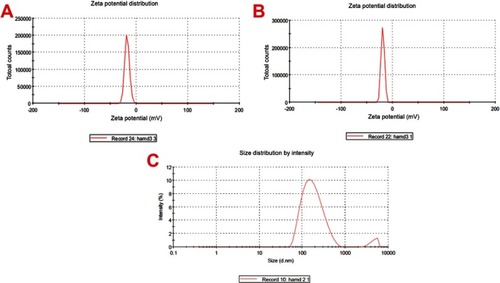
Figure 5 FT-IR and XRD patterns of NPs, DOX-NPs, and DOX.
Abbreviations: DOX, doxorubicin; NPs, nanoparticles; FT-IR, Fourier-transform infrared spectroscopy; XRD, x-ray powder diffraction.
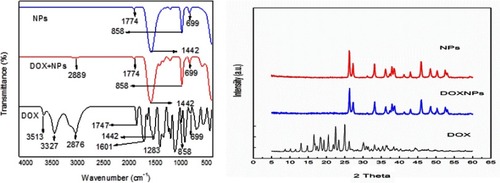
Table 1 Drug loading concentrations, drug content, and encapsulation efficiency of doxorubicin nanoparticles (DOX-NPs)
Figure 6 The in vitro drug release profile of DOX from doxorubicin nanoparticles (DOX-NPs) cell culture.
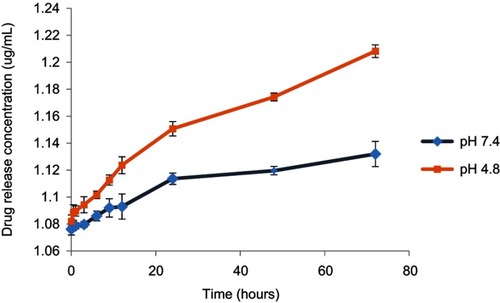
Figure 7 Morphology of MCF-7 cells treated for 48 hrs with DOX as well as doxorubicin nanoparticles (DOX-NPs). (A) Control cells (untreated). (B) Cells treated with free NPs. (C) Cells treated with DOX. (D) Cells treated with DOX-NPs. Red indicators portray cell shrinkage with detachment; yellow arrows portray DOX-NPs coacervates (scale bar: 100 µm).
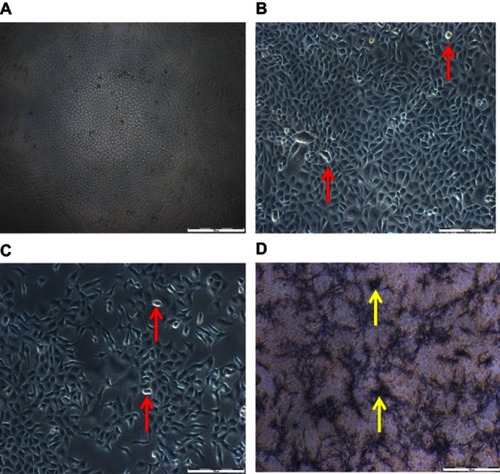
Figure 8 Cytotoxicity of DOX and doxorubicin nanoparticles (DOX-NPs) on MCF-7 cells with the IC50 for DOX-NPs and DOX at 24, 48, and 72 hrs, respectively. The means with asterisk (٭) differed significantly (p˂ 0.05) with the normal untreated group (#).
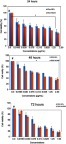
Figure 9 Biocompatibility of cockle shell–derived CaCO3 nanoparticle (NP) on MCF-7 cells.
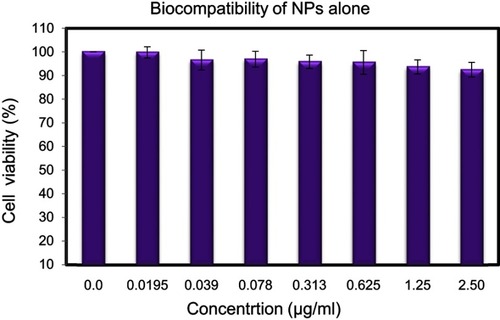
Figure 10 Fluorescent microscopy images of MCF-7 cells at 48 hrs stained by acridine orange and propidium iodide (AO/PI) (A) control MCF-7 cells (untreated), (B) treated with DOX, and (C) treated with doxorubicin nanoparticles (DOX-NPs). Scale bar: 100 µm.
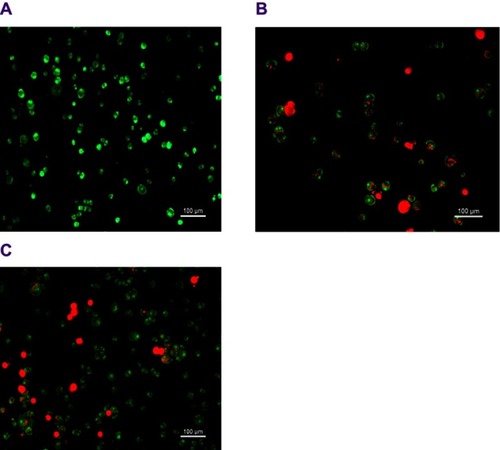
Figure 11 SEM micrographs of surface ultrastructural features. (A) Untreated MCF-7 cells. (B) MCF-7 cells treated with DOX exhibiting membrane blebbing, cell shrinkage with apoptotic body. (C) MCF-7 cells treated with CaCO3NP-DOX exhibiting membrane blebbing, Cell shrinkage (25,000)×, bar 10 µm.
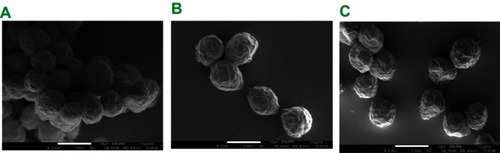
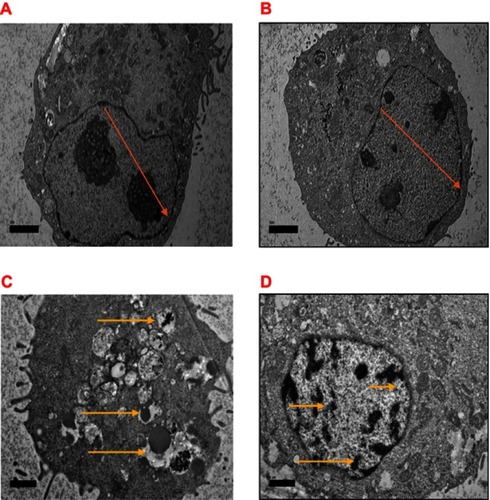
Figure 12 Electron micrographs of MCF-7 cells (A), control untreated cells and (B) treated with NPs exhibiting normal cellular method containing unabridged integrity of cells organelle, with rounded shaped cells containing nucleus and nucleolus chromatin (orange arrow) (C) Treated with DOX with switch nuclear collapse, progressing blebbing, apoptotic body formation (yellow arrow), and (D) treated with NP-DOX revealing chromatin condensation, bar 2 µm.