Figures & data
Table 1 Molecular weights, particle size, TEM and phycocyanin-loading capacity of PEG-b-(PG-g-PEI)
Figure 1 Cumulative releasing profile of phycocyanin from phycocyanin/PEG-b-(PG-g-PEI).
Abbreviation: PEG-b-(PG-g-PEI), poly(ethylene glycol)-b-(poly(l-glutamic acid)-g-polyethylenimine).
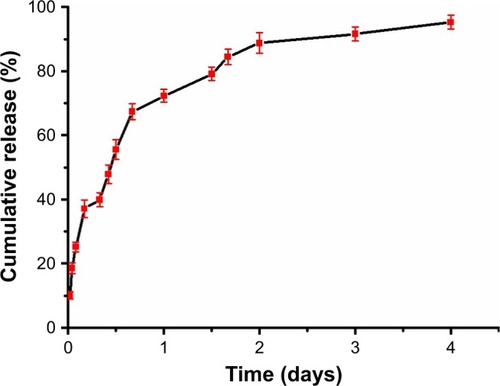
Figure 2 Histopathologic change of liver injury.
Notes: Light microscopy images (×400) in Sham group (A), I/R group (B), phycocyanin group (C) and phycocyanin/PEG-b-(PG-g-PEI) group (D), respectively. Quantitative injury scores, expressed as the mean ± SD, are shown in (E). *Significant increase relative to the Sham group (P<0.01). **Significant decrease relative to the I/R group (P<0.01). ***Significant decrease relative to the I/R group (P<0.01).
Abbreviation: PEG-b-(PG-g-PEI), poly(ethylene glycol)-b-(poly(l-glutamic acid)-g-polyethylenimine).
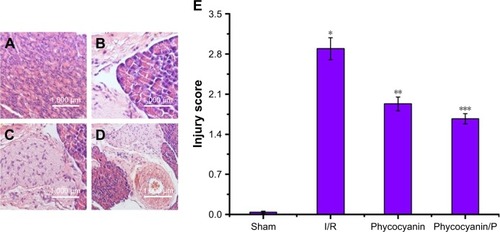
Figure 3 The activities of ALT and AST on HI/RIPII for different groups of rats.
Notes: The blood of Sham, I/R, phycocyanin and phycocyanin/PEG-b-(PG-g-PEI) groups of rats were collected 12 hours after reperfusion and the activities of AST and ALT measured. Results are expressed as mean ± SD. *Significant increase from the Sham group (P<0.01). **Significant decrease from the I/R group (P<0.01). ***Significant decrease from the I/R group (P<0.01).
Abbreviations: I/R, ischemia/reperfusion; ALT, alanine aminotransferase; AST, amino-transferase; HI/RIPII, hepatic ischemia/reperfusion-induced pancreatic islets injury; PEG-b-(PG-g-PEI), poly(ethylene glycol)-b-(poly(l-glutamic acid)-g-polyethylenimine).
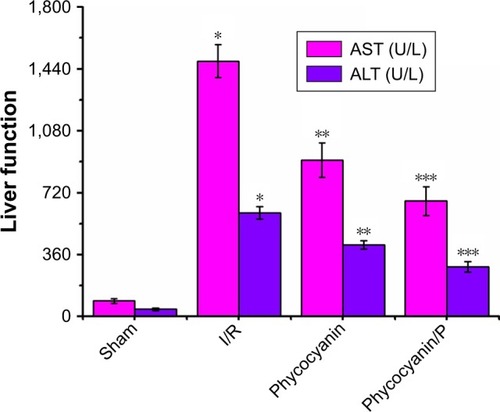
Figure 4 Histopathologic change of pancreatic islet tissues damage.
Notes: Light microscopy images (×400) in Sham group (A), I/R group (B), phycocyanin group (C) and phycocyanin/PEG-b-(PG-g-PEI) group (D), respectively. Quantitative injury scores, expressed as the mean ± SD, are shown in (E). *Significant increase relative to the Sham group (P<0.01). **Significant decrease relative to the I/R group (P<0.01). ***Significant decrease relative to the I/R group (P<0.01).
Abbreviation: PEG-b-(PG-g-PEI), poly(ethylene glycol)-b-(poly(l-glutamic acid)-g-polyethylenimine).
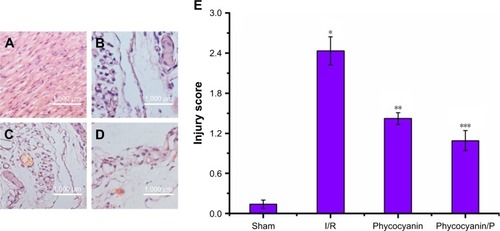
Figure 5 Blood glucose (A), blood insulin (B) and insulin secretion index (C) on HI/RIPII for different groups of rats.
Notes: The blood of Sham, I/R, phycocyanin and phycocyanin/PEG-b-(PG-g-PEI) groups of rats were collected 12 hours after reperfusion and the activities of AST and ALT measured. Results are expressed as mean ± SD. (A) *Significant increase from the Sham group (P<0.01). **Significant decrease from the I/R group (P<0.01). ***Significant decrease from the I/R group (P<0.01). (B) *Significant increase from the Sham group (P<0.01). **Significant decrease from I/R group (P<0.01). ***Significant decrease from I/R groups (P<0.01). (C) *Significant decrease from the Sham group (P<0.01). **Significant increase from the I/R group (P<0.01). ***Significant increase from the I/R group (P<0.01).
Abbreviations: I/R, ischemia/reperfusion; AST, aminotransferase; ALT, alanine aminotransferase; PEG-b-(PG-g-PEI), poly(ethylene glycol)-b-(poly(l-glutamic acid)-g-polyethylenimine).
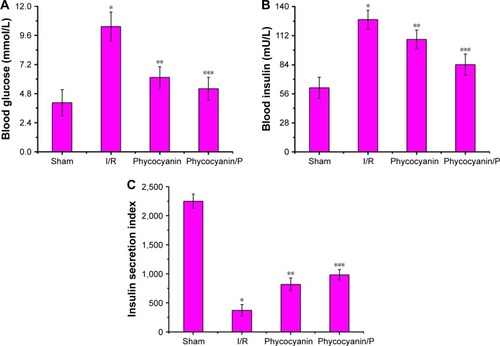
Figure 6 Blood insulin (A) and metabolic rate of glucose (B) on hyperglycemic clamp test.
Notes: The blood of Sham, I/R, phycocyanin and phycocyanin/PEG-b-(PG-g-PEI) groups of rats were collected after hyperglycemic clamp test and blood insulin level and metabolic rate of glucose measured. Results are expressed as mean ± SD. (A) *Significant decrease from the Sham group (P<0.01). **Significant increase from the I/R group (P<0.01). ***Significant increase from the I/R group (P<0.01). (B) *Significant decrease from the Sham group (P<0.01). **Significant increase from the I/R group (P<0.01). ***Significant increase from I/R group (P<0.01).
Abbreviation: PEG-b-(PG-g-PEI), poly(ethylene glycol)-b-(poly(l-glutamic acid)-g-polyethylenimine).
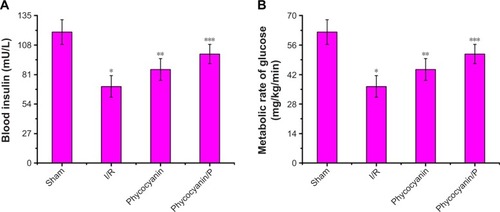
Figure 7 The activity of SOD and the level of MDA on HI/RIPII for different groups of rats.
Notes: The SOD activity and the MDA level of Sham, I/R, phycocyanin and phycocyanin/PEG-b-(PG-g-PEI) groups of rats were measured 12 hours after reperfusion. Results are expressed as mean ± SD. (A) *Significant decrease from the Sham group (P<0.01). **Significant increase from the I/R group (P<0.01). ***Significant increase from the I/R group (P<0.01). (B) *Significant increase from the Sham group (P<0.01). **Significant decrease from the I/R group (P<0.01). ***Significant decrease from the I/R group (P<0.01).
Abbreviations: I/R, ischemia/reperfusion; HI/RIPII, hepatic ischemia/reperfusion-induced pancreatic islets injury; MDA, malondialdehyde; PEG-b-(PG-g-PEI), poly(ethylene glycol)-b-(poly(l-glutamic acid)-g-polyethylenimine); SOD, superoxide dismutase.
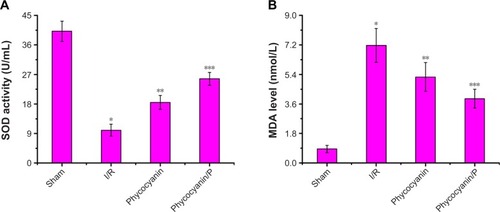
Figure 8 Apoptosis evaluation.
Notes: (A–E) The islet tissues of Sham, I/R, phycocyanin and phycocyanin/PEG-b-(PG-g-PEI) groups of rats were collected 12 hours after reperfusion and the apoptosis measured. Results are expressed as mean ± SD. *Significant increase from the Sham group (P<0.01). **Significant decrease from the I/R group (P<0.01). ***Significant decrease from the I/R group (P<0.01).
Abbreviations: I/R, ischemia/reperfusion; PEG-b-(PG-g-PEI), poly(ethylene glycol)-b-(poly(l-glutamic acid)-g-polyethylenimine).
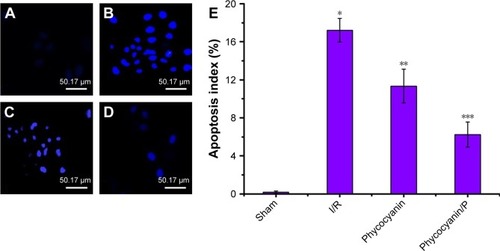
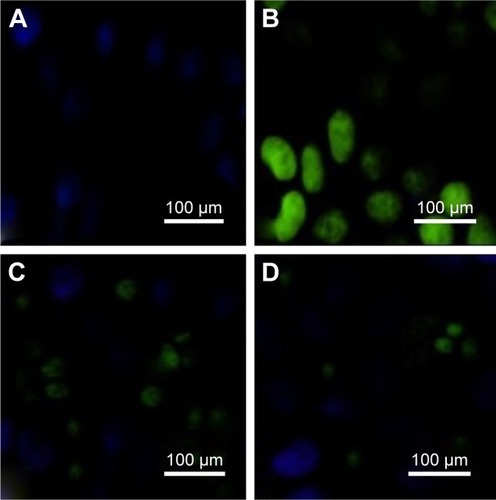
Figure 9 ROSexpression.
Notes: (A–D) The islet tissues of Sham, I/R, phycocyanin and phycocyanin/PEG-b- (PG-g-PEI) groups of rats were collected 12 hours after reperfusion and the ROSexpression measured. The ROS expression is significantly higher in the I/R group than in the Sham group; the ROSexpression is lower in the phycocyanin group than in the I/R group; the ROS expression is significantly lower in the phycocyanin/P group than in the I/Rgroup.
Abbreviations: PEG-b-(PG-g-PEI), poly(ethylene glycol)-b-(poly(l-glutamic acid)-g-polyethylenimine); ROS, reactive oxygen species.
Scheme 1 The structure of phycocyanin/PEG-b-(PG-g-PEI).
Abbreviations: mPEG-NH2, methoxy poly(ethylene glycol) amine; PEG-b-(PG-g-PEI), poly(ethylene glycol)-b-(poly(l-glutamic acid)-g-polyethylenimine).
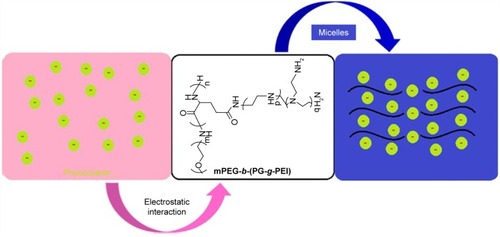
Figure S1 The synthesis of PEG-b-(PG-g-PEI).
Abbreviations: BLG, γ-benzyl l-glutamate; BLG-NCA, γ-benzyl l-glutamate-N-carboxyanhydride; mPEG-NH2, methoxy poly(ethylene glycol) amine; PBLG, poly(γ-benzyl l-glutamate); PEG-b-(PG-g-PEI), poly(ethylene glycol)-b-(poly(l-glutamic acid)-g-polyethylenimine).
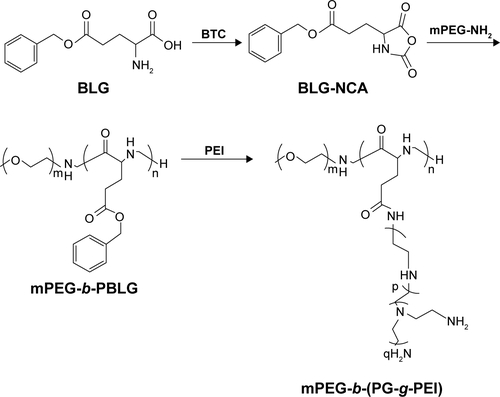
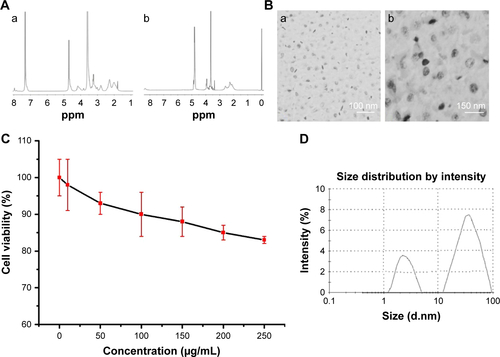
Figure S2 Characterization of PEG-b-(PG-g-PEI) and phycocyanin/PEG-b-(PG-g-PEI).
Notes: (A) 1H NMR spectra of PEG-b-PBLG (a) and PEG-b-(PG-g-PEI) (b); (B) TEM image of PEG-b-PBLG and phycocyanin/PEG-b-(PG-g-PEI); (C) cellular viability of HIT-T15 cells cultured with different concentrations of PEG-b-(PG-g-PEI); (D) diameter of PEG-b-(PG-g-PEI) (left) and phycocyanin/PEG-b-(PG-g-PEI) complexes (right) in PB.
Abbreviations: 1H NMR, 1H-nuclear magnetic resonance; PBLG, poly(γ-benzyl l-glutamate); PEG-b-(PG-g-PEI), poly(ethylene glycol)-b-(poly(l-glutamic acid)-g-polyethyl-enimine); TEM, transmission electron microscopy.