Figures & data
Scheme 1 Schematic illustration of the synthesis of CAAP5, the host-guest complexation with galactose derivatives (G), formation of vesicles (CAAP5G), and their GSH/pH dual-responsive drug release.
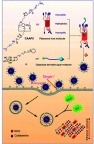
Figure 1 (A) Tyndall effect of CAAP5G and DOX-loaded CAAP5G; (B) SEM image of CAAP5G vesicles; (C) TEM image of CAAP5G vesicles; (D) DLS histogram of CAAP5G vesicles.
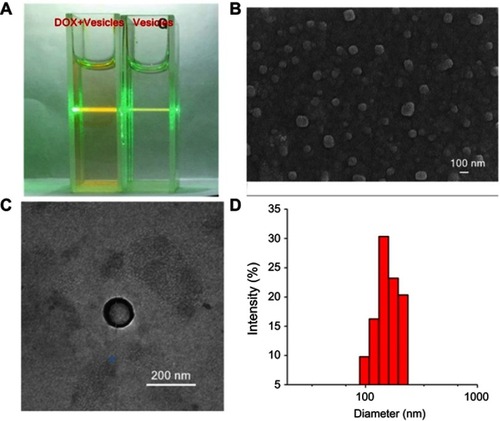
Figure 2 (A) SEM image of DOX-loaded CAAP5G vesicles; (B) DOX release profiles from DOX-loaded CAAP5G vesicles in PBS with GSH (10mM) + pH (4.0), GSH (10 mM)+ pH (7.4), pH (4.0), pH (5.0) and pH (7.4) (n=3).
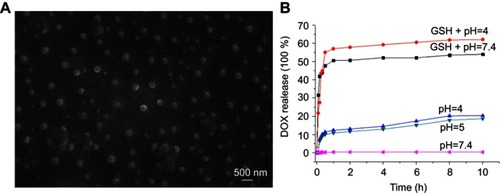
Figure 3 (A) CLSM images of HepG2 cells after being treated with DOX loaded CAAP5G vesicles for 4 h. The final concentration of DOX in the medium was 5 μM. (B) Fluorescence intensity of HepG2 cells treated with free DOX (red line), DOX-loaded CAAP5G vesicles (blue line), DOX-loaded CAAP5G after pre-incubation with lactose for 4 h (green line) by flow cytometry analysis, respectively.
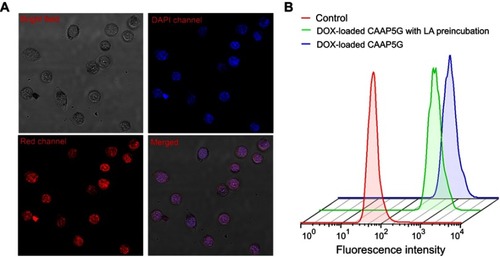
Figure 4 Comparison of DOX-loaded CAAP5G vesicles and DOX on viabilities of HepG2 cells (A) and 293T cells (B) at different time periods; the concentration of DOX was 5 µM. Statistically significant differences were observed (*p<0.05).
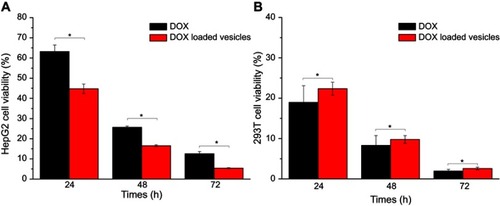
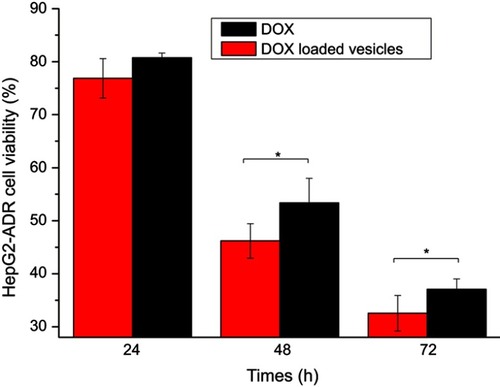
Figure 5 Comparison of DOX-loaded CAAP5G vesicles and DOX on viabilities of HepG2-ADR cells at different time periods; the concentration of DOX was 5 µM. Statistically significant differences were observed (*p<0.05).