Figures & data
Figure 1 A schematic that depicts the two drugs, TP as a chemical drug and MTX as a natural drug, used in this study to reduce left ventricular remodeling of EAM from an immunological aspect.
Abbreviations: EAM, autoimmune myocarditis; IFN, interferon; MTX, methotrexate; NF, nuclear factor; TNF-α, tumor necrosis factor-alpha; TP, triptolide.
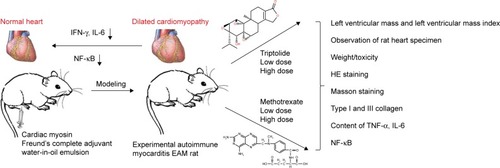
Figure 2 (A) Comparison of BW and LVW for rats in each group. Compared with control, **P<0.01. Compared with the EAM group, ΔP<0.05, ▲P<0.01. (B) Comparison of LVMI in rats for each group. Compared with control, **P<0.01. Compared with the EAM group, ▲P<0.01.
Abbreviations: BW, body weight; EAM, autoimmune myocarditis; H, high dose; L, low dose; LVW, left ventricular weight; LVMI, left ventricular mass index; MTX, methotrexate; TP, triptolide.
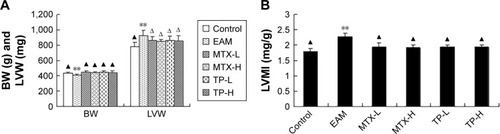
Table 1 Changes in echocardiographic parameters in rats (n=77, mean ± SD)
Table 2 Changes in cardiac histopathology in rats for each group (n=77, mean ± SD)
Figure 3 Macroscopic observation in rats for each group.
Notes: (A) In the control group, the surface of the heart is smooth, with no inflammatory lesions. (B) In the EAM group, the heart became obviously larger and looked gloom, with some gray lesions distributed in a dispersed manner. (C) In the MTX-L group, the enlargement of the heart was reduced and the gray lesions on the surface also decreased significantly. (D) In the MTX-H group, the enlargement of the heart reduced and the gray lesions on the surface decreased significantly or even disappeared. (E) In the TP-L group, the enlargement of the heart reduced and the gray lesions on the surface also decreased significantly. (F) In the TP-H group, the enlargement of the heart reduced and the gray lesions on the surface decreased significantly or even disappeared.
Abbreviations: EAM, autoimmune myocarditis; H, high dose; L, low dose; MTX, methotrexate; TP, triptolide.
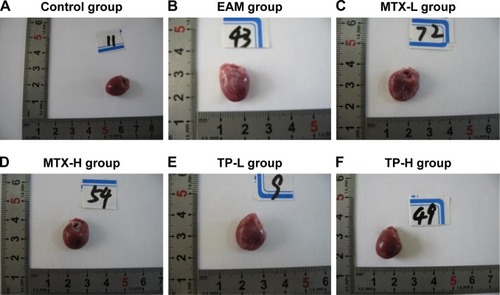
Figure 4 HE of myocardium in rats for each group.
Notes: (A) In the control group, the myocardial cells were arranged in an orderly fashion and had no inflammation infiltration. (B) In the EAM group, the myocardial cells became sparse, with infiltrated inflammation. The proliferation of myocardial interstitial collagen fibrosis was also obvious. (C–F) The inflammation infiltration of the heart decreased and the proliferation of myocardial interstitial collagen fibrosis also became less.
Abbreviations: EAM, autoimmune myocarditis; H, high dose; L, low dose; MTX, methotrexate; TP, triptolide.
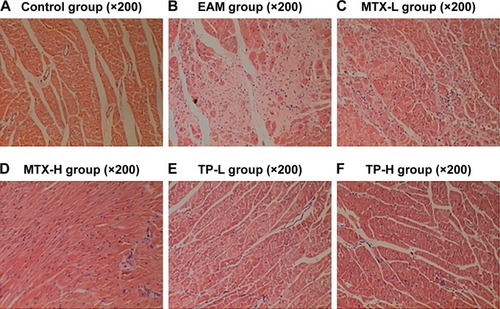
Table 3 Changes in CVF and PVCA in rats of each group (n=77, mean ± SD)
Figure 5 Masson dyeing of myocardium in rats for each group.
Notes: (A) In the control group, a small amount of collagen fibers (green) is found around the myocardial cells. (B) In the EAM group, the collagen fibers were of flaky hyperplasia around the muscle bundle and the myocardial cells. (C–F) The area of the myocardial collagen fibers decreased.
Abbreviations: EAM, autoimmune myocarditis; H, high dose; L, low dose; MTX, methotrexate; TP, triptolide.
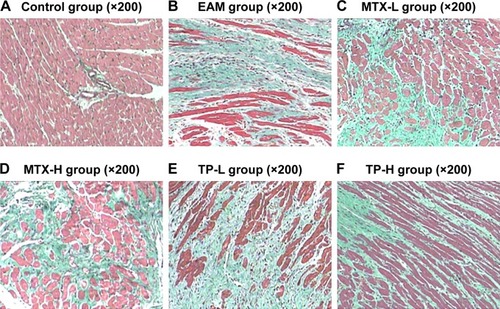
Figure 6 (A) Collagen type I of the myocardium in rats for each group. (a) In the control group, there were only a few brown collagen fibers (type I) around the myocardial cells. (b) In the EAM group, the type I collagen fibers were of obvious hyperplasia. (c–f) The type I collagen fibers decreased significantly. (B) Collagen type III of the myocardium in rats for each group. (a) In the control group, there were only a few brown collagen fibers (type III) around the myocardial cells. (b) In the EAM group, the type III collagen fibers were of obvious hyperplasia. (c, d) The type III collagen fibers decreased to some extent. (e, f) The type III collagen fibers were hyperplasic.
Abbreviations: EAM, autoimmune myocarditis; H, high dose; L, low dose; MTX, methotrexate; TP, triptolide.
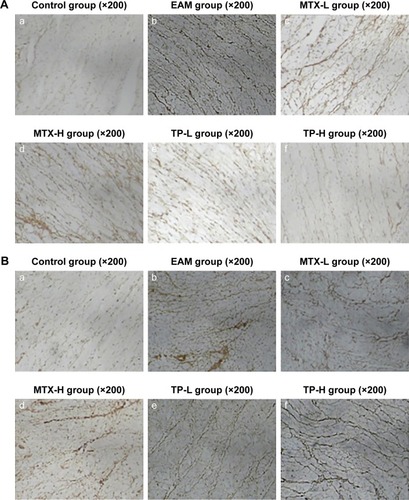
Figure 7 The area (A) and ratio (B) of collagen type I and collagen type III of the myocardium in rats of each group.
Notes: **P<0.01, compared to control; ΔP<0.05 and ▲P<0.01, compared to EAM.
Abbreviations: EAM, autoimmune myocarditis; H, high dose; L, low dose; MTX, methotrexate; TP, triptolide.
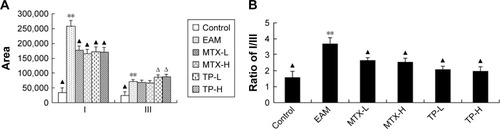
Figure 8 Concentration of TNF-α (A), IL-1 (B), MCP-1 (C), IL-10 (D) and IL-6 (E) in rats of each group.
Notes: **P<0.01, compared to control; ΔP<0.05 and ▲P<0.01, compared to EAM.
Abbreviations: EAM, autoimmune myocarditis; H, high dose; L, low dose; MCP, monocyte chemoattractant protein; MTX, methotrexate; TNF-α, tumor necrosis factor-alpha; TP, triptolide.
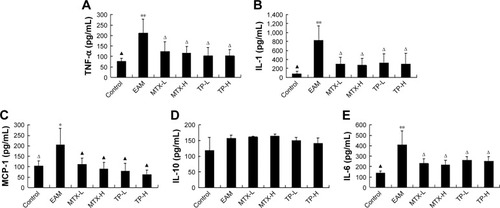
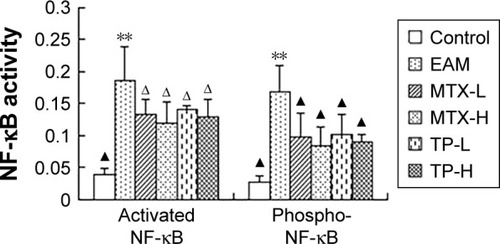
Figure 9 Activities of activated NF-κB and phospho-NF-κB in the myocardium in rats of each group.
Notes: **P<0.01, compared to control; ΔP<0.05 and ▲P<0.01, compared to EAM.
Abbreviations: EAM, autoimmune myocarditis; H, high dose; L, low dose; MTX, methotrexate; NF, nuclear factor; TP, triptolide.