Figures & data
Figure 1 Synthesis, verification and cytotoxicity experiments for PEI-β-CD. (A) Synthetic schematic diagram of PC. (B) 1H NMR spectra of β-CD, PEI (600 Da) and PC. The special peaks are marked with arrows. (C) Cytotoxicity of PEI with different molecular weights and PC at various concentrations. Data are expressed as the mean ± SD (n=3).
Abbreviations: PC, polyethyleneimine-β-cyclodextrin; CDI, Carbonyl diimidazole.
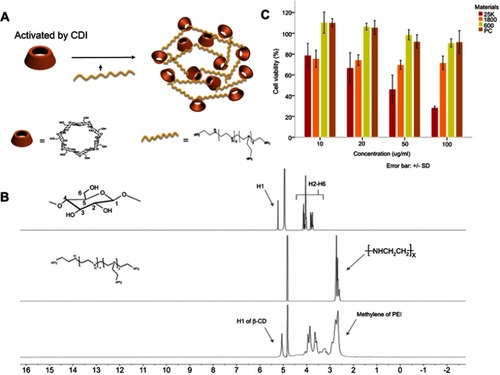
Table 1 Diameter and zeta potential of PC/pDNA at different N/P ratios
Figure 2 Characterization of the PC/Plasmid DNA complexes. (A) Gel retardation analysis of PC/pDNA at different N/P ratios. PC inhibited DNA migration completely at N/P ratios of 4 and above. (B) TEM images, particle size and zeta potential distribution of PC/pDNA complexes with N/P ratios of 30 and 50. At the above N/P ratios, the biophysical properties of the complexes are suitable for cellular uptake.
Abbreviations: PC, polyethyleneimine-β-cyclodextrin; TEM, transmission electron microscope.
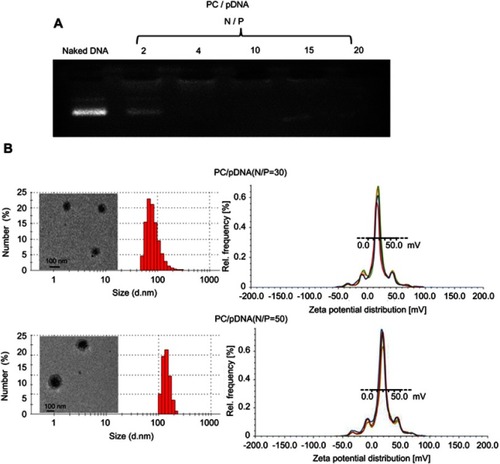
Figure 3 Optimal N/P ratio of PC/pDNA complexes for transfection. (A) GFP expressions in transfected Bel-7402 and HEK-293 cells are shown in inversed fluorescent images. The transfection efficiency of PC was approximate to that of HMW PEI. Cells were incubated with PC/pDNA at N/P ratios of 30 and 50 for 48 h. (B) Percentages of GFP-expressing cells detected by flow cytometry. The naked plasmid (Blank) and HMW PEI/pDNA at an N/P ratio of 10 were employed as the negative and positive controls, respectively.
Abbreviations: GFP, green fluorescent protein; PC, polyethyleneimine-β-cyclodextrin; HMW PEI, high molecular weight polyethyleneimine.
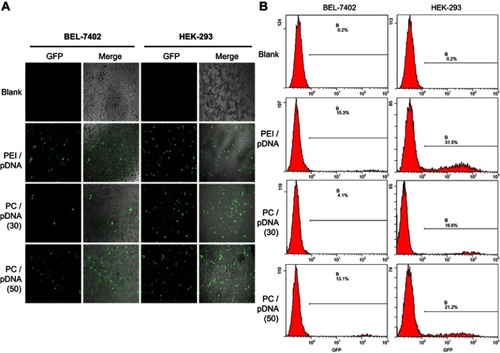
Figure 4 Ferritin expression, TfR upregulation and intracellular iron accumulation. (A) Western blotting assay of ferritin as the result of Fth expression regulated by the AFP promoter. Ferritin was overexpressed in AFP-positive BEL-7402 cells but not in AFP-negative HEK-293 cells. (B) The relative intensity of the Western blotting protein bands showed no significant differences between the PC/Fth and HMW PEI/Fth expression levels (n=3, P>0.05). (C) IF assay of TfR upregulation in the different groups. TfR was specifically expressed in transfected BEL-7402 cells (the fluorescence of the blank group was derived from a small amount of TfR originally expressed within tumor cells), but not in the HEK-293 cells regardless of whether they were transfected or not. Green fluorescence represents TfR, and blue fluorescence represents the cell nucleus. The scale bar represents 20 μm. (D) Prussian blue staining assay. Blue-stained particles representing accumulated iron were obvious within the transfected BEL-7402 cells treated with FAC (indicated by black arrows). Few blue granules were detected in the HEK-293 cells because of FAC supplementation. The blank and HMW PEI/Fth were employed as the negative and positive controls, respectively. The scale bar represents 50 μm.
Abbreviations: TfR, transferrin receptor; Fth, ferritin heavy chain; IF, immunofluorescence; FAC, ferric ammonium citrate.
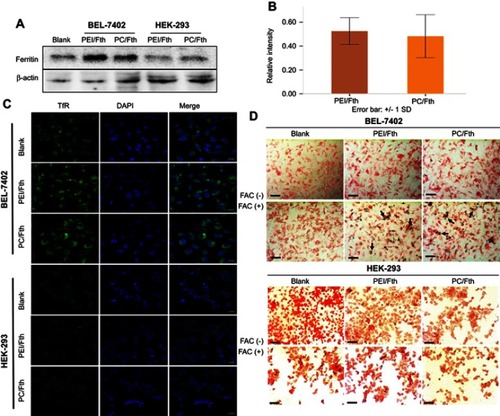
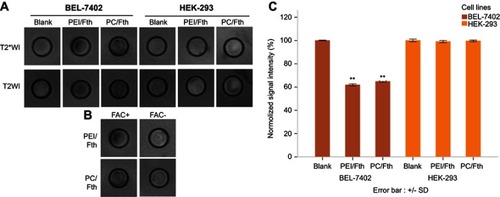
Figure 5 T2-/T2*-weighted MR imaging of the collected cell samples. (A) A noticeable low signal intensity was observed in transfected cells supplemented with FAC in the AFP-positive BEL-7402 cells but not in AFP-negative HEK-293 cell line. (B) T2*-weighted MR imaging of transfected BEL-7402 cells with or without FAC supplementation. The signal was lower for transfected cells supplemented with than without FAC. (C) The signal intensity analysis for the ROI (8 mm2) of each group (n=3). The blank and HMW PEI/Fth were employed as the negative and positive controls, respectively. Data are expressed as the mean ± SD. ** Significant difference between groups (P<0.01).
Abbreviations: FAC, ferric ammonium citrate; ROI, region of interest; Fth, ferritin heavy chain.