
Figures & data
Figure 1 Physicochemical properties of RA-Cur with RA/Cur weight ratio of 25:1 in solid state.
Notes: (A) RA-Cur appearance; (B) SEM micrographs; (C) thermal analysis; (D) IR spectra; (E) XRD analysis. (a) Cur, (b) RA, (c) physical mixture of RA and Cur, and (d) RA-Cur. Abbreviations: Cur, curcumin; IR, infrared; RA, rebaudioside A; RA-Cur, RA-based self-nanomicellizing solid dispersion containing Cur; SEM, scanning electron microscopy; XRD, X-ray diffraction.
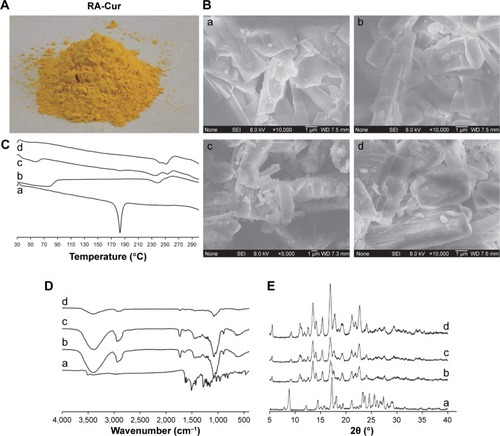
Figure 2 RA-Cur stability.
Notes: RA-Cur stored at 4°C and 25°C with protection from light. At 2-month intervals, RA-Cur was dissolved in water and its encapsulation efficiency was determined by HPLC. Cur remaining in RA-Cur (%) was expressed as the actual level of the encapsulation efficiency to each interval normalized to its actual encapsulation efficiency at day 0 (n=3).
Abbreviations: Cur, curcumin; ND, not determined; RA, rebaudioside A; RA-Cur, RA-based self-nanomicellizing solid dispersion containing Cur.
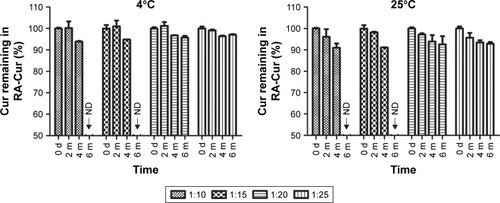
Figure 3 Characterization of RA-Cur with an RA/Cur weight ratio of 25:1 in water.
Notes: (A) The appearance of the RA-Cur micelle solution; (B) TEM morphology of RA-Cur micelles (×400 k magnification, bar =50 nm); (C) micelle size distribution; (D) zeta potential characterization of the RA-Cur micelle solution (RA/Cur weight ratio of 25:1).
Abbreviations: Cur, curcumin; RA, rebaudioside A; RA-Cur, RA-based self-nanomicellizing solid dispersion containing Cur; TEM, transmission electron microscopy.
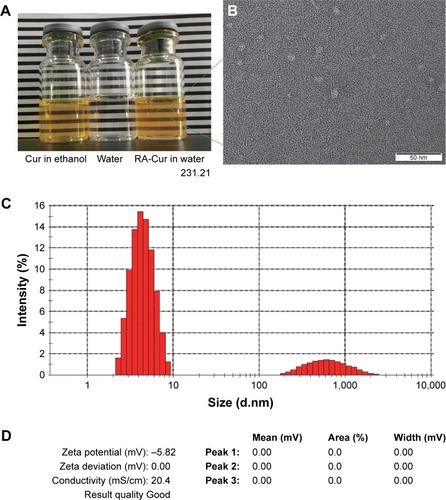
Figure 4 Measured FRAP values.
Note: Measured FRAP values of the RA solution, free Cur, and RA-Cur (A) at different concentrations as a function of time, and (B) with different incubation times as a function of concentration (n=3).
Abbreviations: Cur, curcumin; FRAP, ferric reducing antioxidant power; RA, rebaudioside A; RA-Cur, RA-based self-nanomicellizing solid dispersion containing Cur; sol, solvent.
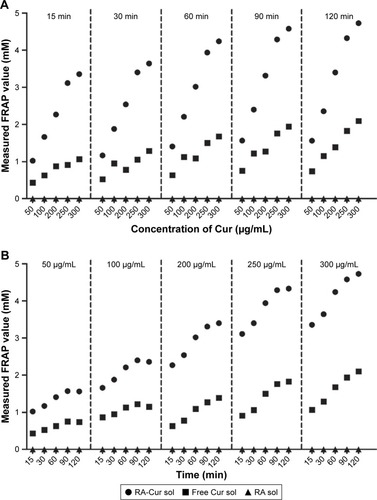
Figure 5 Absorption of RA-Cur in rat intestinal tract.
Notes: Absorption profiles of Cur in intestinal segments: (A) quantitative determination, (B) fluorescence micrographs of the free Cur group, and (C) fluorescence micrographs of the RA-Cur group 0.5 hours after oral administration. Absorption profiles of Cur in intestinal segments: (D) quantitative determination, (E) fluorescence micrographs of the free Cur group, and (F) fluorescence micrographs of the RA-Cur group 1.5 hours after oral administration. Mean ± SD, n=6. *P<0.05 vs free Cur group with each same intestinal segment. Scale bar =100 µm.
Abbreviations: Cur, curcumin; RA, rebaudioside A; RA-Cur, RA-based self-nanomicellizing solid dispersion containing Cur.
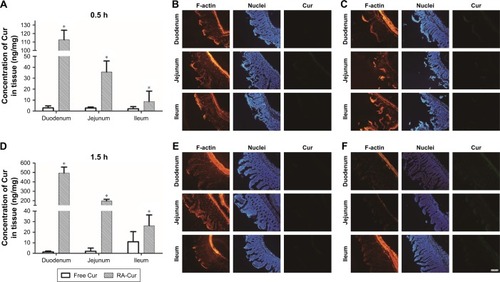
Figure 6 Pharmacokinetic studies.
Note: Pharmacokinetics profiles of RA-Cur and free Cur (*P<0.05 vs free Cur group at each same time point) (mean ± SD, n=6).
Abbreviations: Cur, curcumin; RA-Cur, RA, rebaudioside A; RA-based self-nanomicellizing solid dispersion containing Cur.
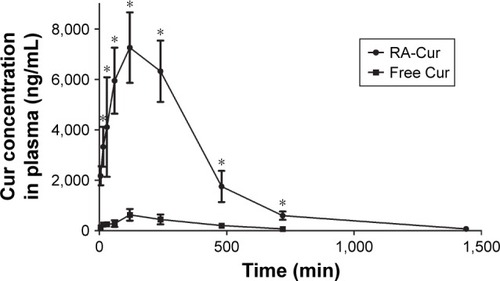
Figure 7 Therapeutic effects of oral administration of RA-Cur on UC in mice induced by DSS.
Notes: (A) Body weight change profiles. Mouse body weight was measured throughout the experimental duration, and it was normalized as a percentage of the day 0 body weight. The colon and spleen were harvested on day 12. (B) Colon length and (C) spleen weight in different mice groups were measured. *P<0.05 vs healthy control group, ≤P<0.05 vs DSS control group. Each point represents the mean ± SD (n=8).
Abbreviations: Cur, curcumin; DSS, dextran sodium sulfate; RA, rebaudioside A; RA-Cur, RA-based self-nanomicellizing solid dispersion containing Cur; UC, ulcerative colitis.
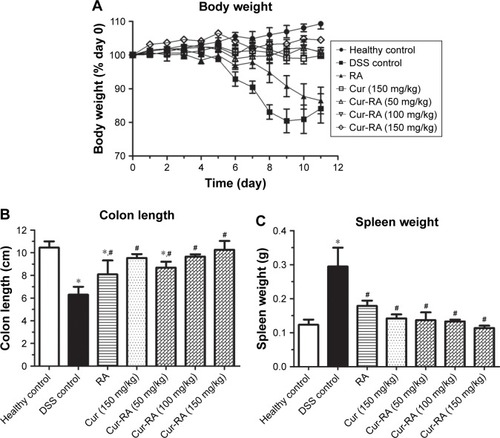
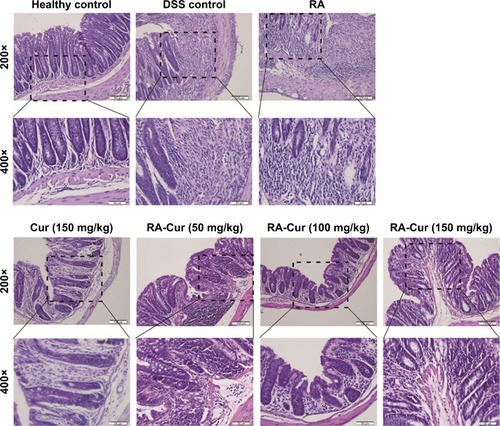
Figure 8 Histopathologic examinations of colon tissues.
Notes: Representative colon sections from the healthy control group, DSS control group, RA-treated group, Cur 150 mg/kg-treated group, RA-Cur 50 mg/kg-treated group, RA-Cur 100 mg/kg-treated group, and RA-Cur 150 mg/kg-treated group. Scale bar to 200× =100 µm. Scale bar to 400× =50 µm.
Abbreviations: Cur, curcumin; DSS, dextran sodium sulfate; RA, rebaudioside A; RA-Cur, RA-based self-nanomicellizing solid dispersion containing Cur.
Data availability
All relevant data are within the paper and the Supplementary materials.