
Figures & data
Figure 1 Physical and chemical properties of AgNP solution.
Notes: (A) The ultraviolet-visible absorption spectrum of AgNPs, with a peak at 407.9 nm. (B) The morphology and size of AgNPs under TEM observation. (C) The particle size distribution of AgNPs measured by DLS.
Abbreviations: AgNP, silver nanoparticle; DLS, dynamic light scattering; TEM, transmission electron microscopy.
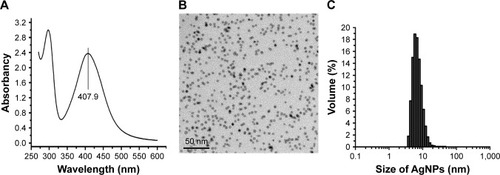
Figure 2 Antibacterial effect of AgNPs against the resistant Pseudomonas aeruginosa.
Notes: (A) The mean values of MIC and MBC of AgNPs against P. aeruginosa. (B) The values of MIC50 and MBC90 of AgNPs against P. aeruginosa. (C) The effect of different concentrations of P. aeruginosa on MIC of AgNPs. (D) The time–bactericidal curve of AgNPs against P. aeruginosa. **P<0.01.
Abbreviations: AgNP, silver nanoparticle; MBC, minimal bactericidal concentration; MIC, minimal inhibitory concentration.
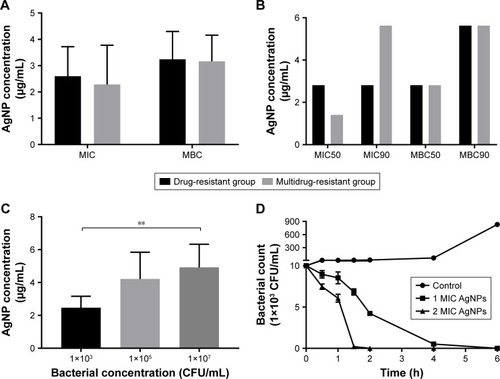
Figure 3 Morphology and structure alterations of AgNP-treated Pseudomonas aeruginosa observed by TEM.
Notes: (A, B) The untreated P. aeruginosa. (C, D) The changes of P. aeruginosa post-AgNP treatment at the early stage. (E, F) The changes of P. aeruginosa post-AgNP treatment at the late stage.
Abbreviations: AgNP, silver nanoparticle; TEM, transmission electron microscopy.
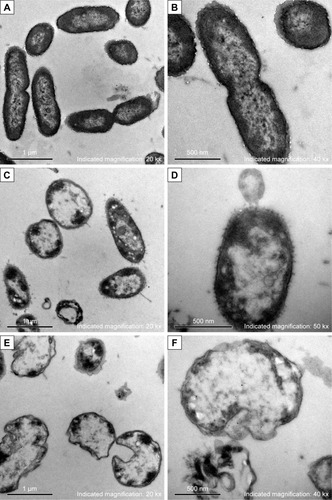
Figure 4 Expression and function analysis of the proteins identified by TMT-labeled quantitative proteomic in AgNP-treated multidrug-resistant Pseudomonas aeruginosa.
Notes: (A) The volcano map of differentially expressed proteins. The abscissa denotes the ratios of differential expression proteins in the AgNP-treated P. aeruginosa vs those in the untreated bacteria; the ordinate represents the P-values between the two groups. (B) The number of differentially expressed proteins identified by TMT-labeled quantitative proteomic. (C) GO enrichment cluster analysis of the differential proteins. The red color represents the proteins relevant to biological processes; the yellow, cellular localization and the green, molecular function. Those above the horizontal axis are the upregulated proteins and those below the axis are the downregulated proteins. (D) KEGG pathway clustering heat map of the differential proteins. The deeper the blue color, the more significant the enrichment is. (E) The interactive network of three groups of proteins and their differential expression in the AgNP-treated P. aeruginosa vs those in the untreated bacteria. (F) The comparative analysis of oxidative stress-related proteins between pre- and post-AgNP treatment.
Abbreviations: AgNP, silver nanoparticle; GO, Gene Ontology; KEGG, Kyoto Encyclopedia of Genes and Genomes; PA, P. aeruginosa; TMT, Tandem Mass Tag.
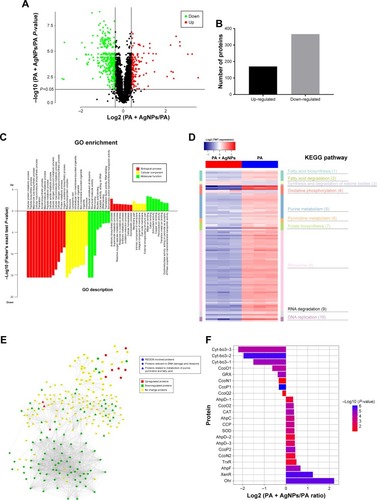
Figure 5 Changes of ROS production in AgNP-treated multidrug-resistant Pseudomonas aeruginosa at different time intervals under fluorescence microscopy with ×400 magnification.
Notes: (A) The untreated P. aeruginosa without observable fluorescence. (B–F) Fluorescence observation of the bacteria treated with AgNPs at different points of 0.5, 0.75, 1, 1.5, and 2 hours, respectively, indicating that AgNPs induce ROS production in a time-dependent manner.
Abbreviations: AgNP, silver nanoparticle; ROS, reactive oxygen species.
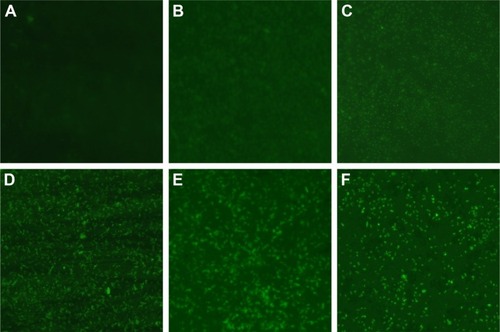
Figure 6 Changes of ROS production in multidrug-resistant Pseudomonas aeruginosa exposed to different concentrations of AgNPs under fluorescence microscopy with ×400 magnification.
Notes: (A) The untreated P. aeruginosa without observable fluorescence. (B–E) Fluorescence observation of the bacteria exposed to 5.625, 11.25, 22.5, and 45 µg/mL AgNPs, respectively.
Abbreviations: AgNP, silver nanoparticle; ROS, reactive oxygen species.
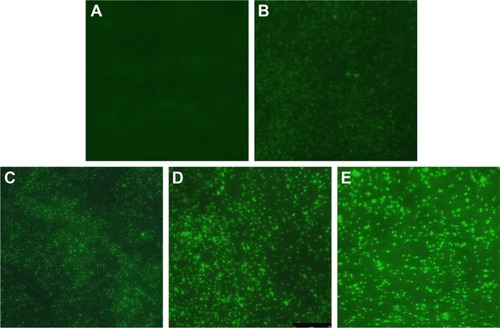
Figure 7 Changes of ROS and O2− production in AgNP-treated multidrug-resistant Pseudomonas aeruginosa.
Notes: (A) RFU–time curve of ROS production of the bacteria at different AgNP-treated time points of 0, 0.25, 0.5, 0.75, 1, 1.5, and 2 hours. (B) RFU–concentration curve of ROS production of the bacteria, exposed to different AgNPs concentrations of 0, 5.625, 11.25, 22.5, and 45 µg/mL. (C) The O2− content–time curve of the bacteria at different AgNP-treated time points of 0, 0.25, 0.5, 0.75, 1, 1.5, and 2 hours. (D) The O2− content–concentration curve of the bacteria, exposed to different AgNP concentrations of 0, 5.625, 11.25, 22.5, and 45 µg/mL, respectively.
Abbreviations: AgNP, silver nanoparticle; RFU, relative fluorescence unit; ROS, reactive oxygen species.
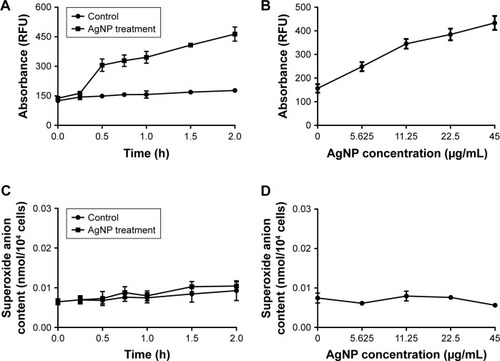
Figure 8 Alteration of the activities of CAT, POD, and SOD in AgNP-treated multidrug-resistant Pseudomonas aeruginosa.
Notes: (A–C) The activity–time curves of CAT, POD, and SOD, respectively, when P. aeruginosa was exposed to AgNP treatment at different time points of 0, 0.5, 1, 1.5, 2, 3, and 4 hours, respectively. (D–F) The activity–concentration curves of CAT, POD, and SOD, respectively, when the bacteria were addressed by a series of AgNP concentrations of 0, 5.625, 11.25, 22.5, and 45 µg/mL, respectively.
Abbreviations: AgNP, silver nanoparticle; CAT, catalase; POD, peroxidase; SOD, superoxide dismutase.
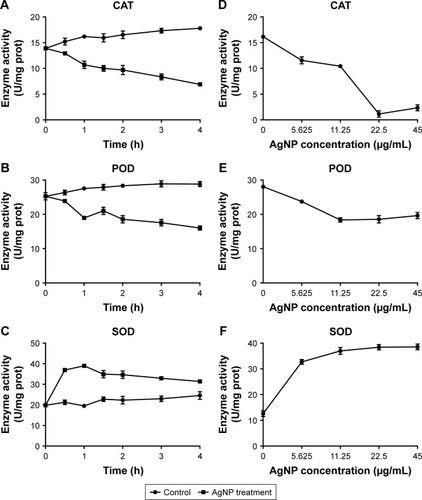
Figure 9 The effect of addition of antioxidant on the growth of AgNP-treated multidrug-resistant Pseudomonas aeruginosa.
Notes: (A) Bacterial growth–time curve in different groups treated by AgNPs together with GSH, AsA, or GSH+AsA within 2 hours, compared to the groups without AgNP treatment or antioxidant addition. (B) Bacterial growth–time curve in different groups treated with AgNPs together with GSH, AsA, or GSH+AsA within 24 hours, compared to the groups without AgNP treatment or antioxidant addition.
Abbreviations: AgNP, silver nanoparticle; AsA, ascorbic acid; GSH, glutathione; OD, optical density; PA, P. aeruginosa.
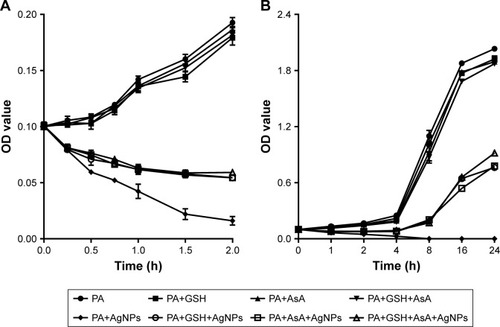
Figure 10 Apoptosis-like effect of AgNP-treated multidrug-resistant Pseudomonas aeruginosa.
Notes: (A) The apoptosis-like rate of the untreated P. aeruginosa measured by flow cytometry. (B) The apoptosis-like rate of the AgNP-treated bacteria measured by flow cytometry. (C) The comparative analysis of the average apoptosis-like rate of five biological replicates between the AgNP-treated and -untreated groups. **P<0.01.
Abbreviations: AgNP, silver nanoparticle; PA, P. aeruginosa; PI, propidium iodide.
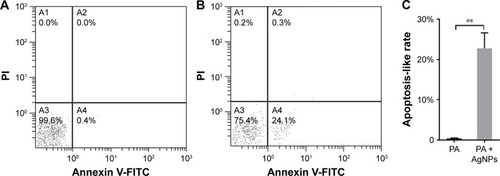
Table S1 The values of MIC and MBC of AgNPs against drug-resistant and multidrug-resistant Pseudomonas aeruginosa
Table S2 Differential expression of REDOX-involved proteins detected by TMT-labeled quantitative proteomics in Pseudomonas aeruginosa
Table S3 Differential expression of proteins involved in the macromolecular synthesis identified by TMT-labeled quantitative proteomics in Pseudomonas aeruginosa