Figures & data
Scheme 1 (A) The structure representations of functionalized DTX-LNS. (B) The delivering mechanism of functionalized DTX-LNS. P-DTX-LNS were delivered into the tumor sites by EPR effect. Besides, N-DTX-LNS were transferred into the tumor tissue via the receptor-mediated transcytosis.
Abbreviations: EPR effect, enhanced permeation and retention effect.
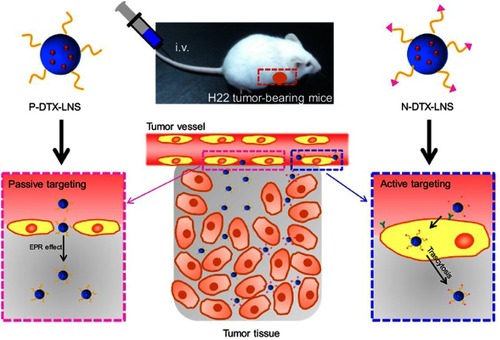
Figure 1 Synthesis and characterization of DSPE-PEG2000-NGR. (A) The synthesis of DSPE. PEG2000-NGR. (B) The 1H NMR spectra of DSPE-PEG2000-NGR.
Abbreviation: NMR, nuclear magnetic resonance.
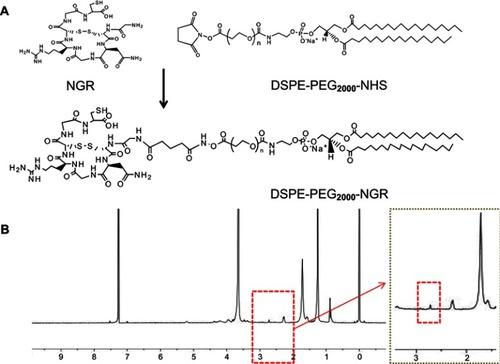
Table 1 Characterization of LNS formulations (n=3)
Figure 2 Characterizations. (A) Particle size and size distribution. (B) TEM images. (C) Energy Dispersive Spectrometer (EDS) map of N-DTX-LNS.
Abbreviation: TEM, transmission electron microscopy.
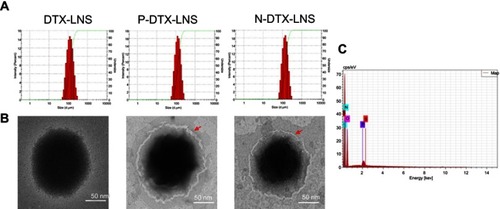
Figure 3 In vitro stability and drug release study (n=3). (A) Particle size changes of DTX-LNS, P-DTX-LNS and N-DTX-LNS at different conditions. (B) In vitro release of DTX from LNS. Data were given as mean ± SD (n=3).
Abbreviation: SD, standard deviation.
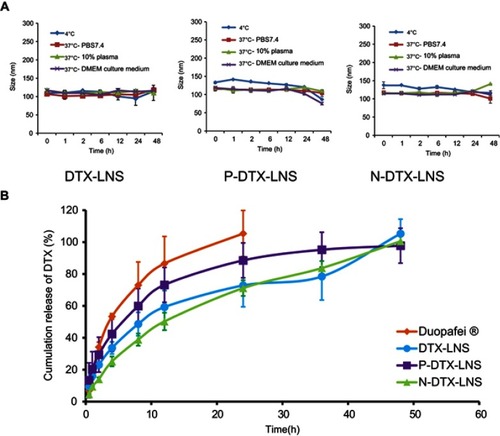
Table 2 IC50 of different DTX formulations (n=3)
Figure 4 In vitro cytotoxicity of various concentrations of blank LNS, free DTX, DTX-LNS, P-DTX-LNS and N-DTX-LNS in HepG2 cells at 48 hrs (n=3). Data were given as mean ± SD (n=3), *p<0.05, **p< 0.01, ***p<0.001 (From top to bottom indicated the differences of blank LNS, free DTX, DTX-LNS, P-DTX-LNS and N-DTX-LNS, “-” represented that there was no significant difference).
Abbreviation: HepG2 cells, human hepatocellular liver carcinoma cells.
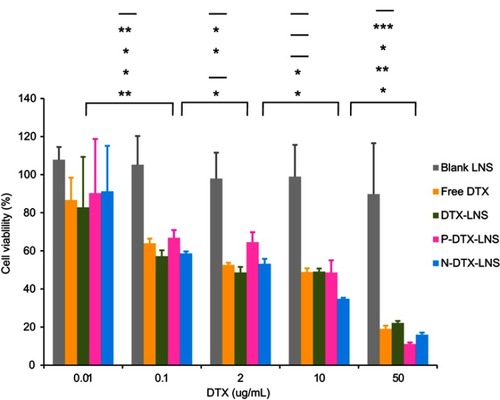
Figure 5 (A) Fluorescence microscopy images of HepG2 cells and HL-7702 cells after incubation with various formulations of coumarin-6 (C6) for 1 or 4 hrs including free C6 (Lane 1), C6-LNS (Lane 2), P-C6-LNS (Lane 3) and N-C6-LNS (Lane 4), for which blue and green represent the fluorescence of DAPI and C6 (bar represents 50 μm). (B) Internalization rates of the free C6, C6-LNS, P-C6-LNS and N-C6-LNS analyzed by flow cytometry. Data were given as mean ± SD (n= 3), *p<0.05, **p<0.01, ***p<0.001.
Abbreviations: C6, coumarin-6; DAPI, 2-(4-amidinophenyl)-6-indolecarbamidine dihydrochloride.
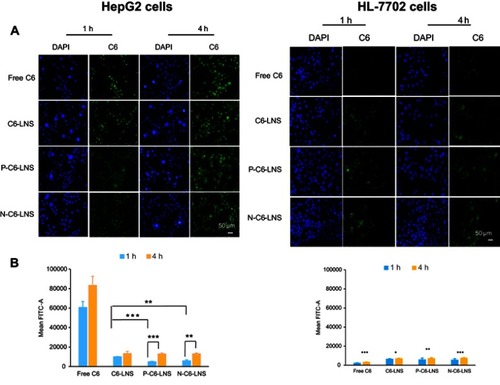
Figure 6 In vivo real-time and ex vivo imaging study of H22 tumor-bearing mice after intravenous injection of free DiR, DiR-LNS, P-DiR-LNS and N-DTX-LNS. (A) In vivo imaging of the mice at different time intervals; (B) The ex vivo images of heart, liver, spleen, lung, kidney and tumor after 24-hrs iv. injection after the mice were dissected at 24 hrs post administration; (C) Fluorescent intensity based on the ex vivo results. Data were given as mean ± SD (n=3), **p<0.01.
Abbreviations: DiR, 1,1′-Dioctadecyl-3,3,3′,3′-tetramethylindotricarbocyanine iodide; IVIS, in vivo real-time fluorescence imaging system.
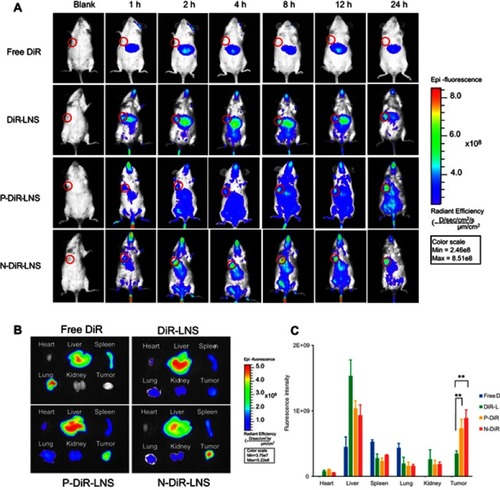
Figure 7 In vivo antitumor efficacy of NS groups, free DTX, DTX-LNS, P-DTX-LNS and N-DTX-LNS on H22 tumor-bearing mice. (A) Photographs of tumors excised from each treatment group on day 21; (B) Variation of tumor volume; (C) Variation of tumor weight; (D) Body weight change of each treatment group. Data were given as mean ± SD (n=5), **p<0.01, ***p<0.001.
Abbreviation: NS, normal saline.
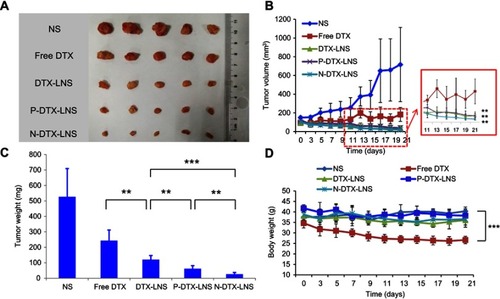
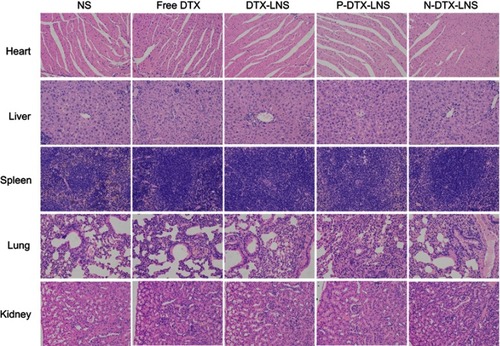
Figure 8 Histological assays (Representative microscopy images of H&E-stained histological sections after treatment with NS groups, free DTX, DTX-LNS, P-DTX-LNS and N-DTX-LNS). Magnification 200×.
Abbreviations: NS, normal saline; H&E, hematoxylin and eosin.