Figures & data
Figure 1 Schematic of the preparation of the cell–scaffold complex.
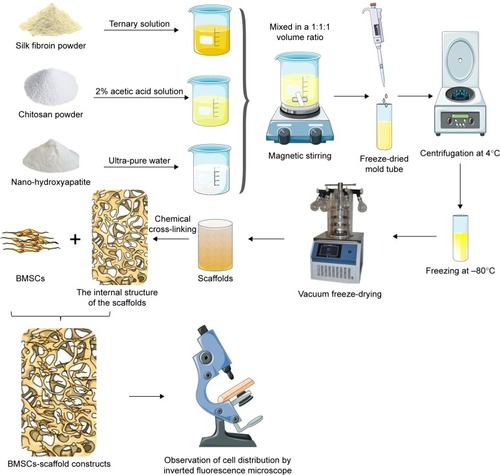
Figure 2 Morphology of passage 3 bone marrow mesenchymal stem cells (A, 40×; B, 100×; C, 200×).
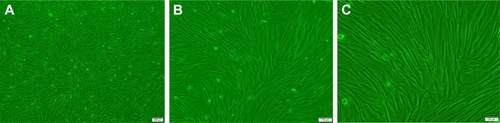
Table 1 Height, diameter, and weight of the silk fibroin/chitosan/nano-hydroxyapatite scaffolds with gradient pore diameters (mean±SD, n=4)
Figure 3 Appearance of the silk fibroin/chitosan/nano-hydroxyapatite scaffolds: Scaffold-1 (A), Scaffold-2 (B), and Scaffold-3 (C).
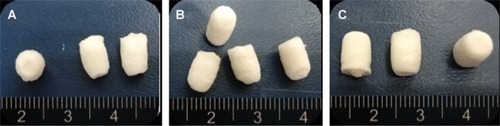
Figure 4 Height (A), diameter (B), and weight (C) of silk fibroin/chitosan/nano-hydroxyapatite scaffolds.
Notes: aP<0.05, vs Scaffold-1. bP<0.05, vs Scaffold-2.
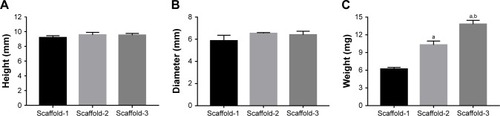
Table 2 Porosity, hot-water dissolution rate, and water swelling rate of the silk fibroin/chitosan/nano-hydroxyapatite scaffolds with gradient pore diameters (mean±SD, %, n=4)
Figure 5 Porosity (A), water swelling rate (B), and hot-water dissolution rate (C) of silk fibroin/chitosan/nano-hydroxyapatite scaffolds.
Notes: aP<0.05, vs Scaffold-1. bP<0.05, vs Scaffold-2.
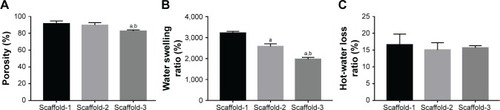
Figure 6 Hot-water dissolution rate as a function of dissolution time for silk fibroin/chitosan/nano-hydroxyapatite scaffolds.
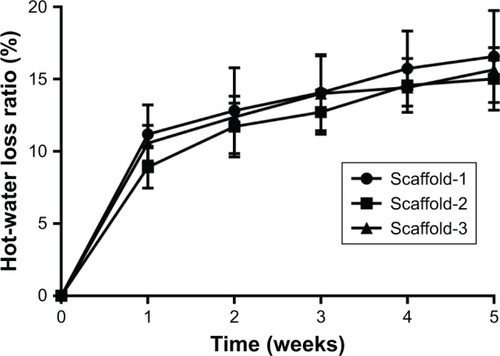
Figure 7 Hot-water dissolution rate vs dissolution time of the silk fibroin/chitosan/nano-hydroxyapatite scaffolds: (A) Scaffold-1, (B) Scaffold-2, and (C) Scaffold-3.
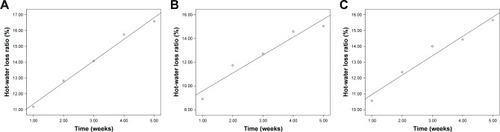
Figure 8 Stress–strain curves of silk fibroin/chitosan/nano-hydroxyapatite scaffolds: (A) Scaffold-1, (B) Scaffold-2, and (C) Scaffold-3. The averaged curves for comparing the three scaffolds (D). The linear fit curves for comparing the elastic modulus of scaffolds (E).
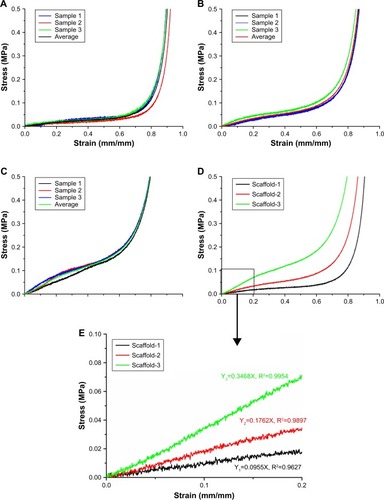
Table 3 Water swelling rate of the silk fibroin/chitosan/nano-hydroxyapatite scaffolds with gradient pore diameters before and after compression (mean±SD, %, n=4)
Figure 9 The water swelling rate of the silk fibroin/chitosan/nano-hydroxyapatite scaffolds with gradient pore diameters before and after compression.
Note: aP<0.05, vs water swelling rate before compression.
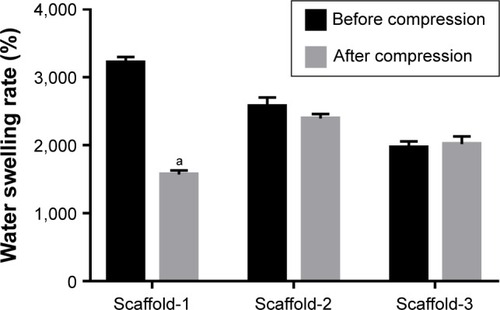
Table 4 Pore size of the different layers of the silk fibroin/chitosan/nano-hydroxyapatite scaffolds with gradient pore diameters (mean±SD, μm, n=4)
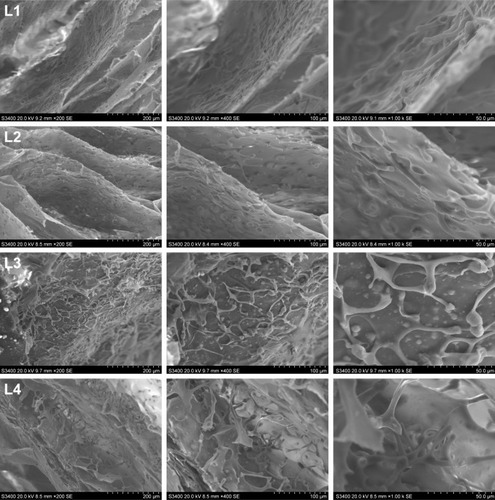
Figure 10 Scanning electron micrographs (×210) showing the internal structure of the silk fibroin/chitosan/nano-hydroxyapatite scaffolds.
Abbreviation: L, layer.
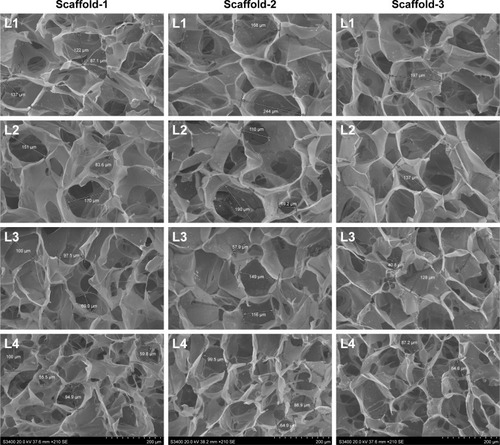
Figure 11 Pore size of the silk fibroin/chitosan/nano-hydroxyapatite scaffolds (A and B).
Notes: aP<0.05, vs L1. bP<0.05, vs L2. cP<0.05, vs L3.
Abbreviation: L, layer.
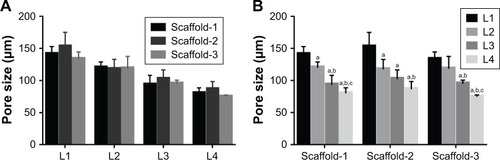
Table 5 Optical density of the cells in different layers of the silk fibroin/chitosan/nano-hydroxyapatite scaffolds (mean±SD, n=4)
Figure 12 Cell proliferation curves corresponding to the different layers of the cell-scaffold complex.
Note: *P<0.05.
Abbreviation: L, layer.
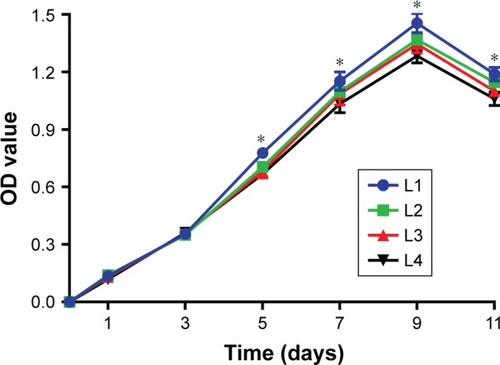
Figure 13 DAPI staining of the cell-scaffold complex after 9 days of culture (A, 100×; B, 200×).
Abbreviations: DAPI, 4,6-diamidino-2-phenylindole; L, layer.
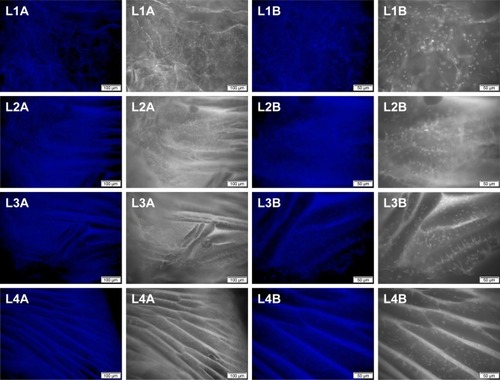
Figure 14 Scanning electron microscope observation of cell morphology and distribution of the cell-scaffold complex at 9 days of culture.
Abbreviation: L, layer.